
Gold and silver last sold off was during a severe liquidity crisis in bonds in March 2020. Subsequently, gold and silver rallied strongly. We face a similar situation today.
This article shows that the selloff in gold and silver is a sign of a developing bond crisis, which will likely freeze the $12.5 trillion repo market with severe consequences for all financial markets. That will require the Fed to backstop treasuries by offering to buy up to $2.5 trillion of them to ensure sufficient liquidity is in the system. We walk the reader through the evidence and likely outcomes of a rapidly developing situation.
Introduction
The current decline in gold and silver values is echoed in other commodities, particularly energy with WTI oil having declined from $105 to $82 in only 13 trading sessions. This selloff in commodities has been sudden and extensive, despite continuing problems in the Middle East. While the US government reports that oil is flowing relatively freely through Hormuz, independent evidence says otherwise. This is what the IMF is saying:
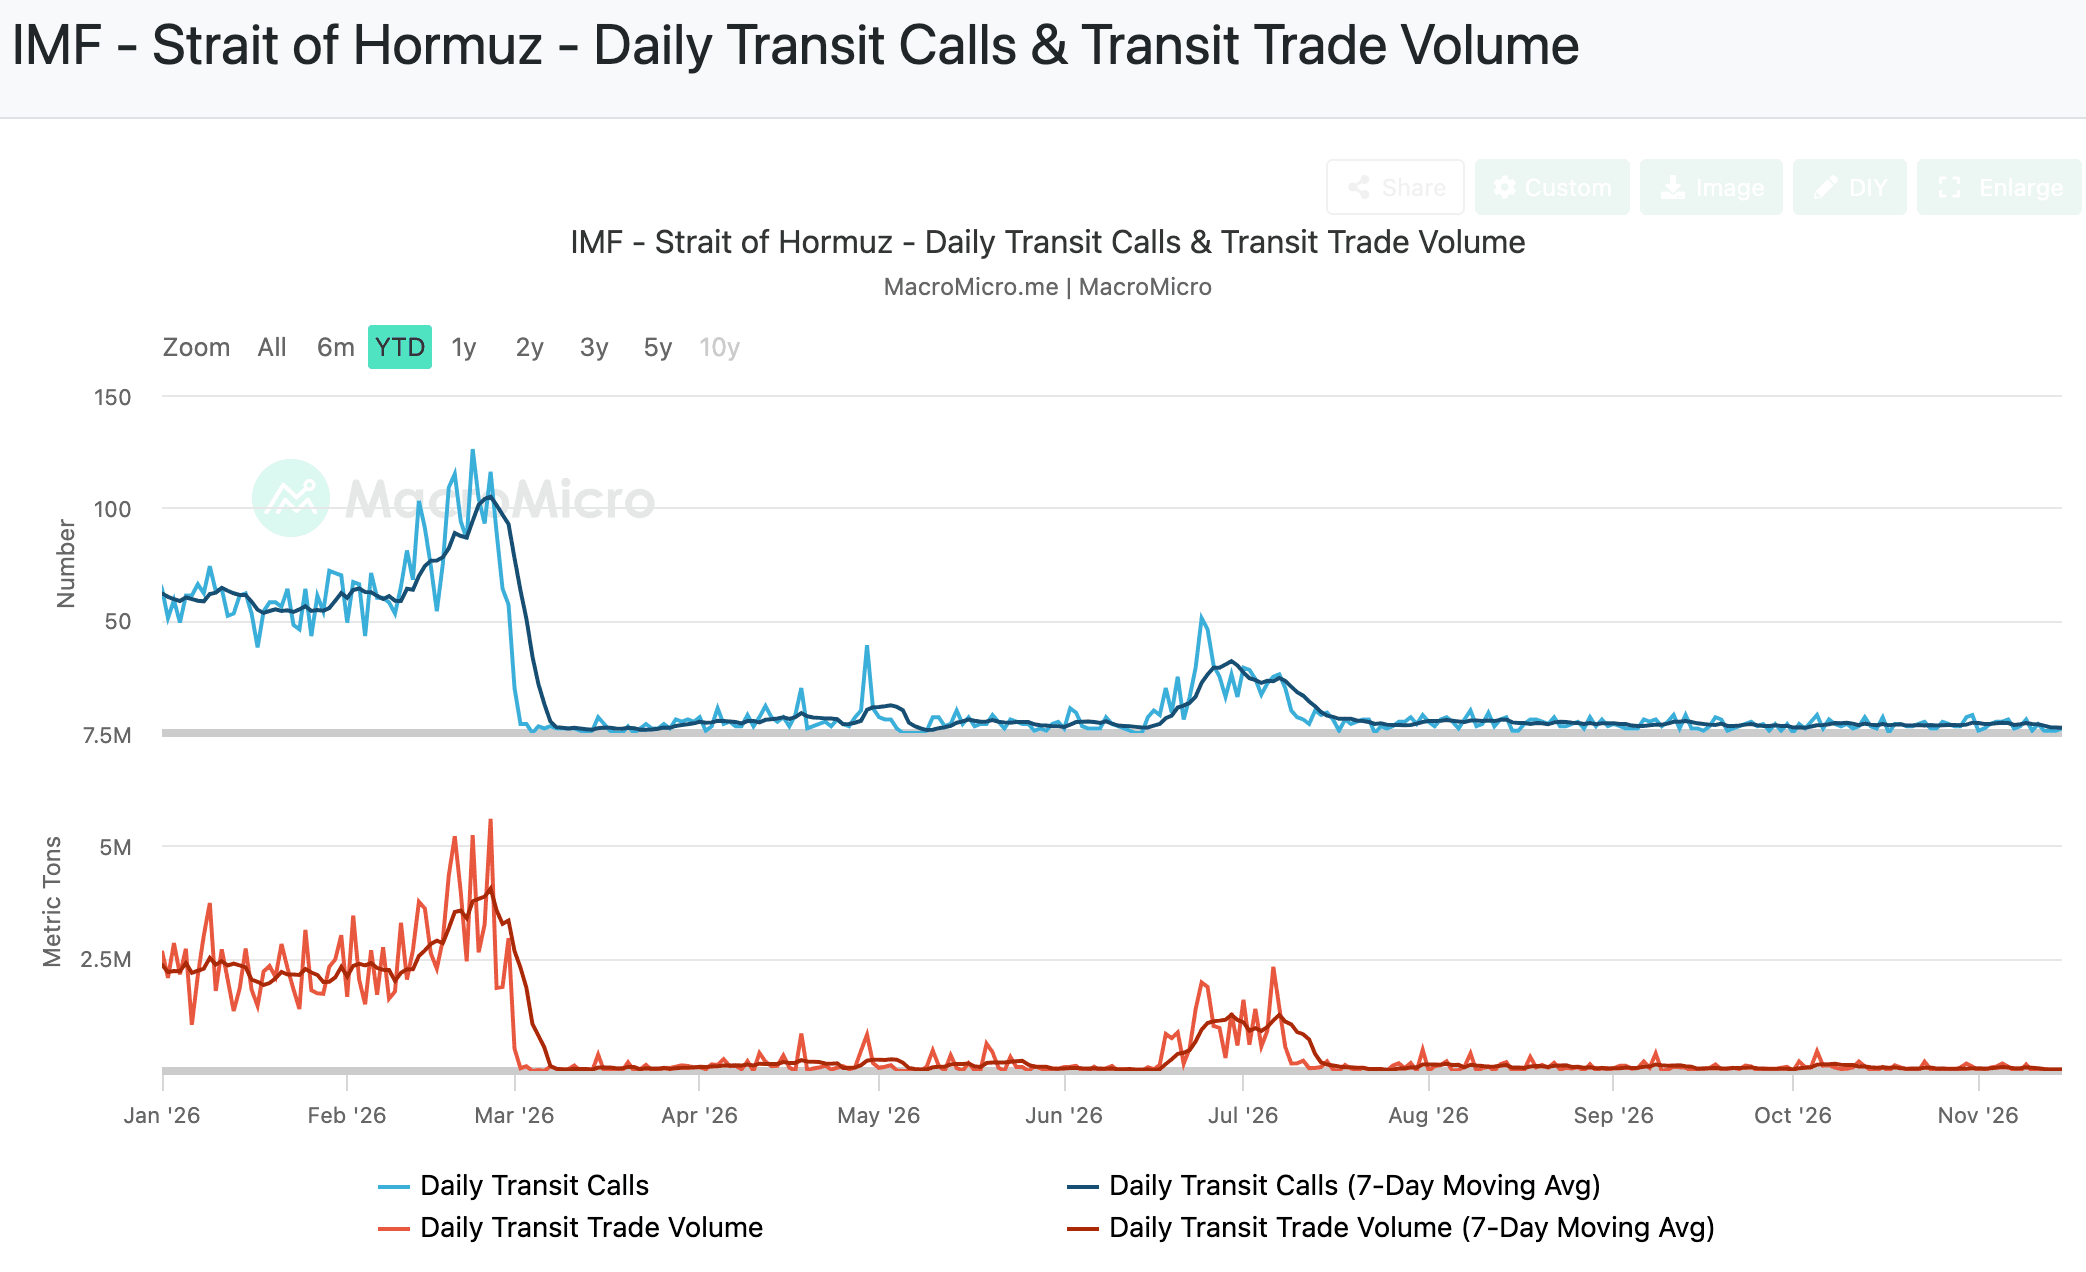
Transits through Hormuz are close to zero. Furthermore, we know that the Houthis have disrupted Saudi’s pipeline to Yanbu, hitting pumping stations and the pipeline itself. It has also gained control over the Bab el Mandab pinch point at the southern entrance to the Red Sea. We can be sure that little if any Saudi oil is being shipped from Yanbu. In other words, the high-spending Saudi regime now has little or no income. And the oil price is not reflecting the seriousness of the global supply deficit.
The dollar’s trade-weighted index has been rising, a little over 5% since August. But this reflects weakness in the euro and yen, rather than a desire for dollars on their own merits. Does this relative dollar strength explain why gold, silver, and commodity prices generally are so weak?
It seems unlikely. The most likely explanation is tightening dollar credit, going beyond rising Fed funds rates. When rising borrowing costs coincide with increased borrowing, together they indicate businesses experiencing margin pressures and a decline in cash flows. It is the earliest sign of a slowdown and recession in business activity, and that is what appears to be happening now.
With consumer lending static, bank credit grew at an annualised rate of 3.4% in September, which more than doubled to 7.3% in October. Commercial and industrial loans grew 13.7% annualised in October, compared with 7.4% in Q3, all indicating cash flow replacement demand from slowing economic activity. That’s the real economy, not the one necessarily reflected in government statistics. We can now say with greater certainty that the real economy faces a slowdown in activity, which with rising interest rates and corporations overburdened by debts risks resulting in significant corporate failures.
The crisis in bank lending particularly affects private equity and similar borrowers. These shadow banks’ borrowing increased at an annualised 20.2% in October, having slowed significantly in the previous five quarters. The sharp increase indicates that cash injections into their indebted investments are required to keep them afloat.
Increasing demand for bank credit is followed by increased caution on lending. The Fed’s survey of loan officers in October confirmed that banks are getting more cautious in their lending, particularly to small and medium sized businesses.
At the same time, there are rising prices, only softened by the temporary illusion of falling energy and other commodity prices. We know this is temporary because of the facts on the ground contradicting government propaganda (see the IMF daily transits chart above). Furthermore, pressure on prices to rise are always underestimated and there is no reason to think that will not be the case today.
Trouble in repos
So far, there’s little evidence of liquidity difficulties in the $12.5 trillion repo market. But overnight rates have risen significantly, as the chart below of the Secured Overnight Funding rate (SOFR) indicate:
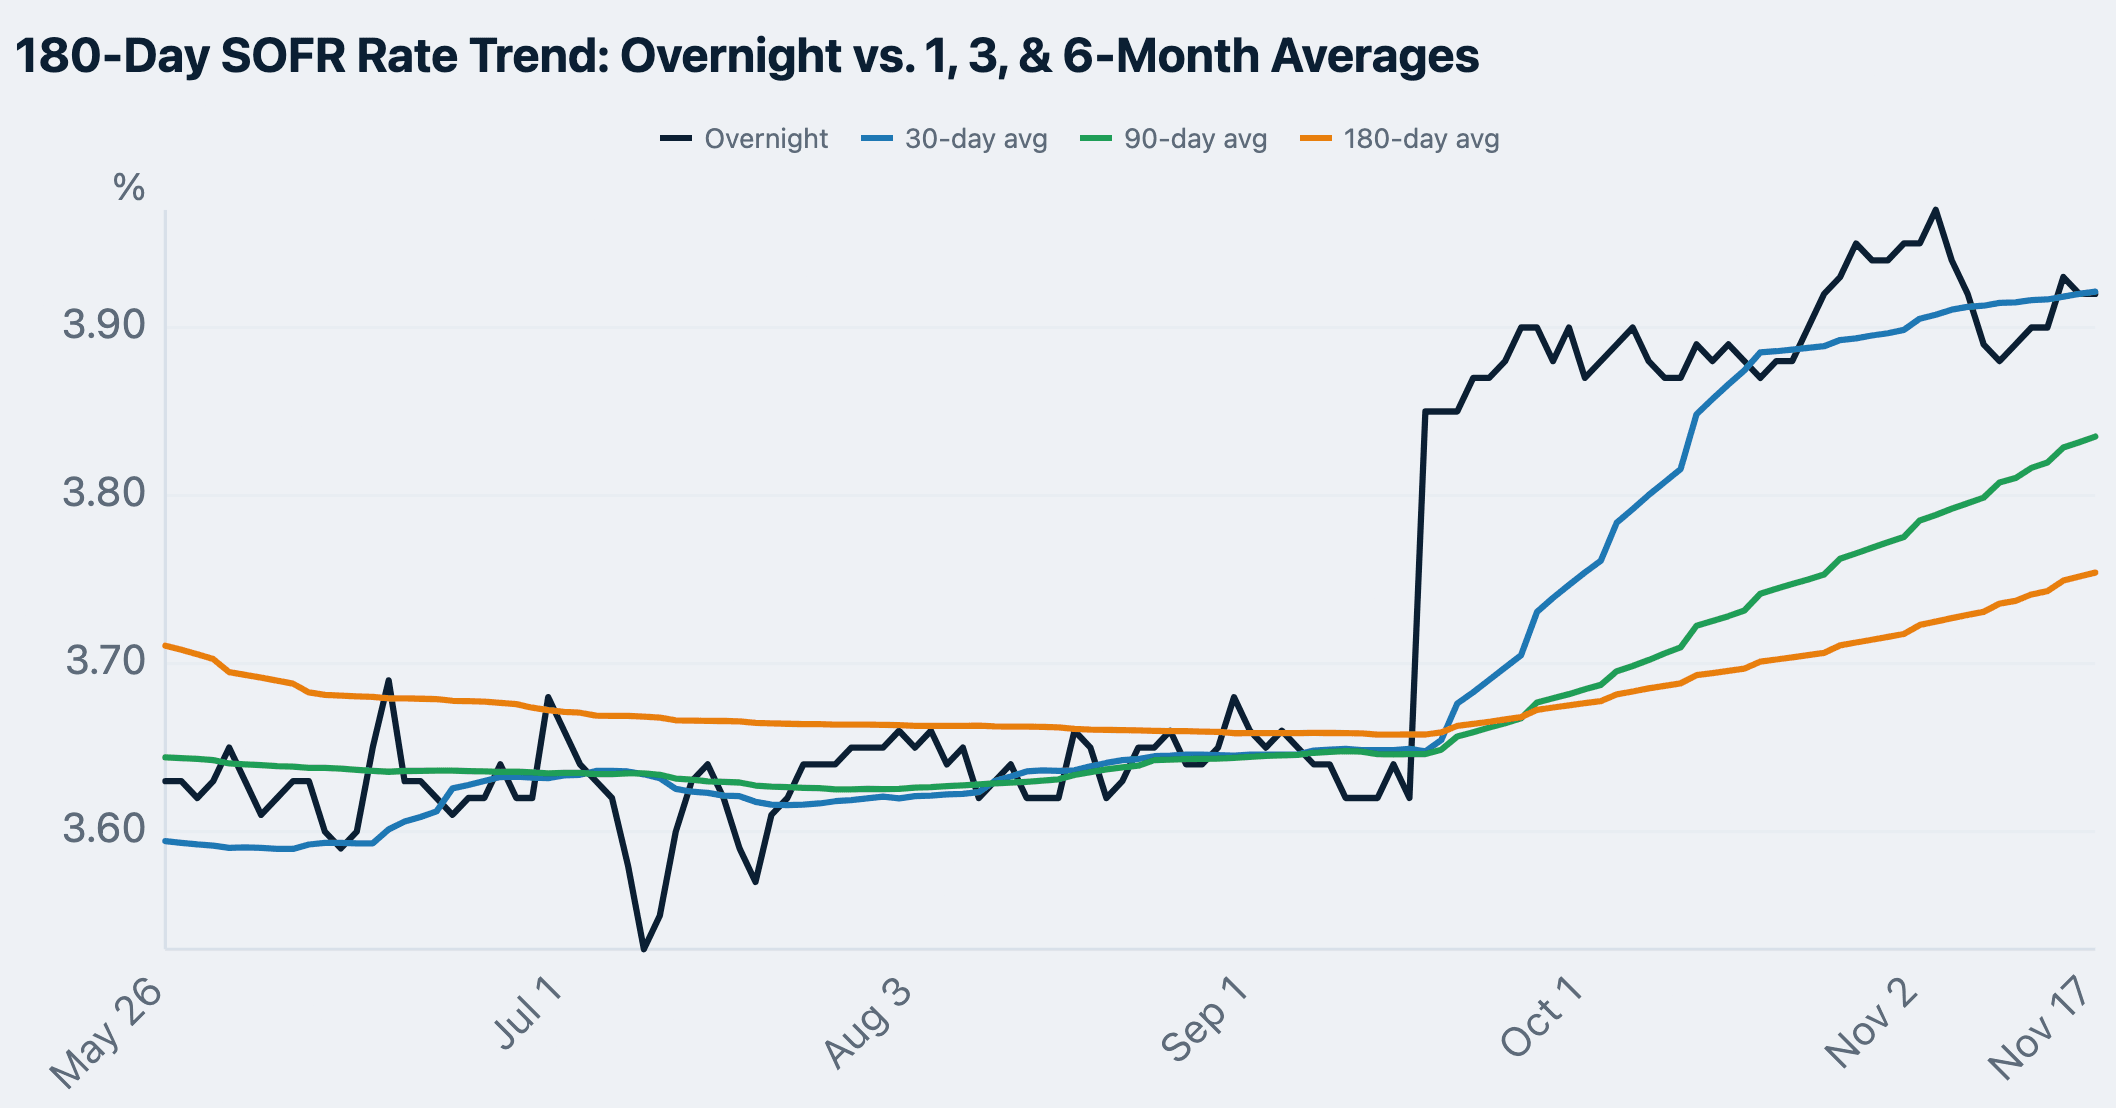
The current Fed funds rate is 3.75%—4.00% and will almost certainly rise further in December. The cost of funding by shadow banks is rising, which includes private equity and hedge funds. Along with a slowing economy, suddenly risk is emerging in this vital market.
Treasury yields are beginning to rise again after a modest correction:
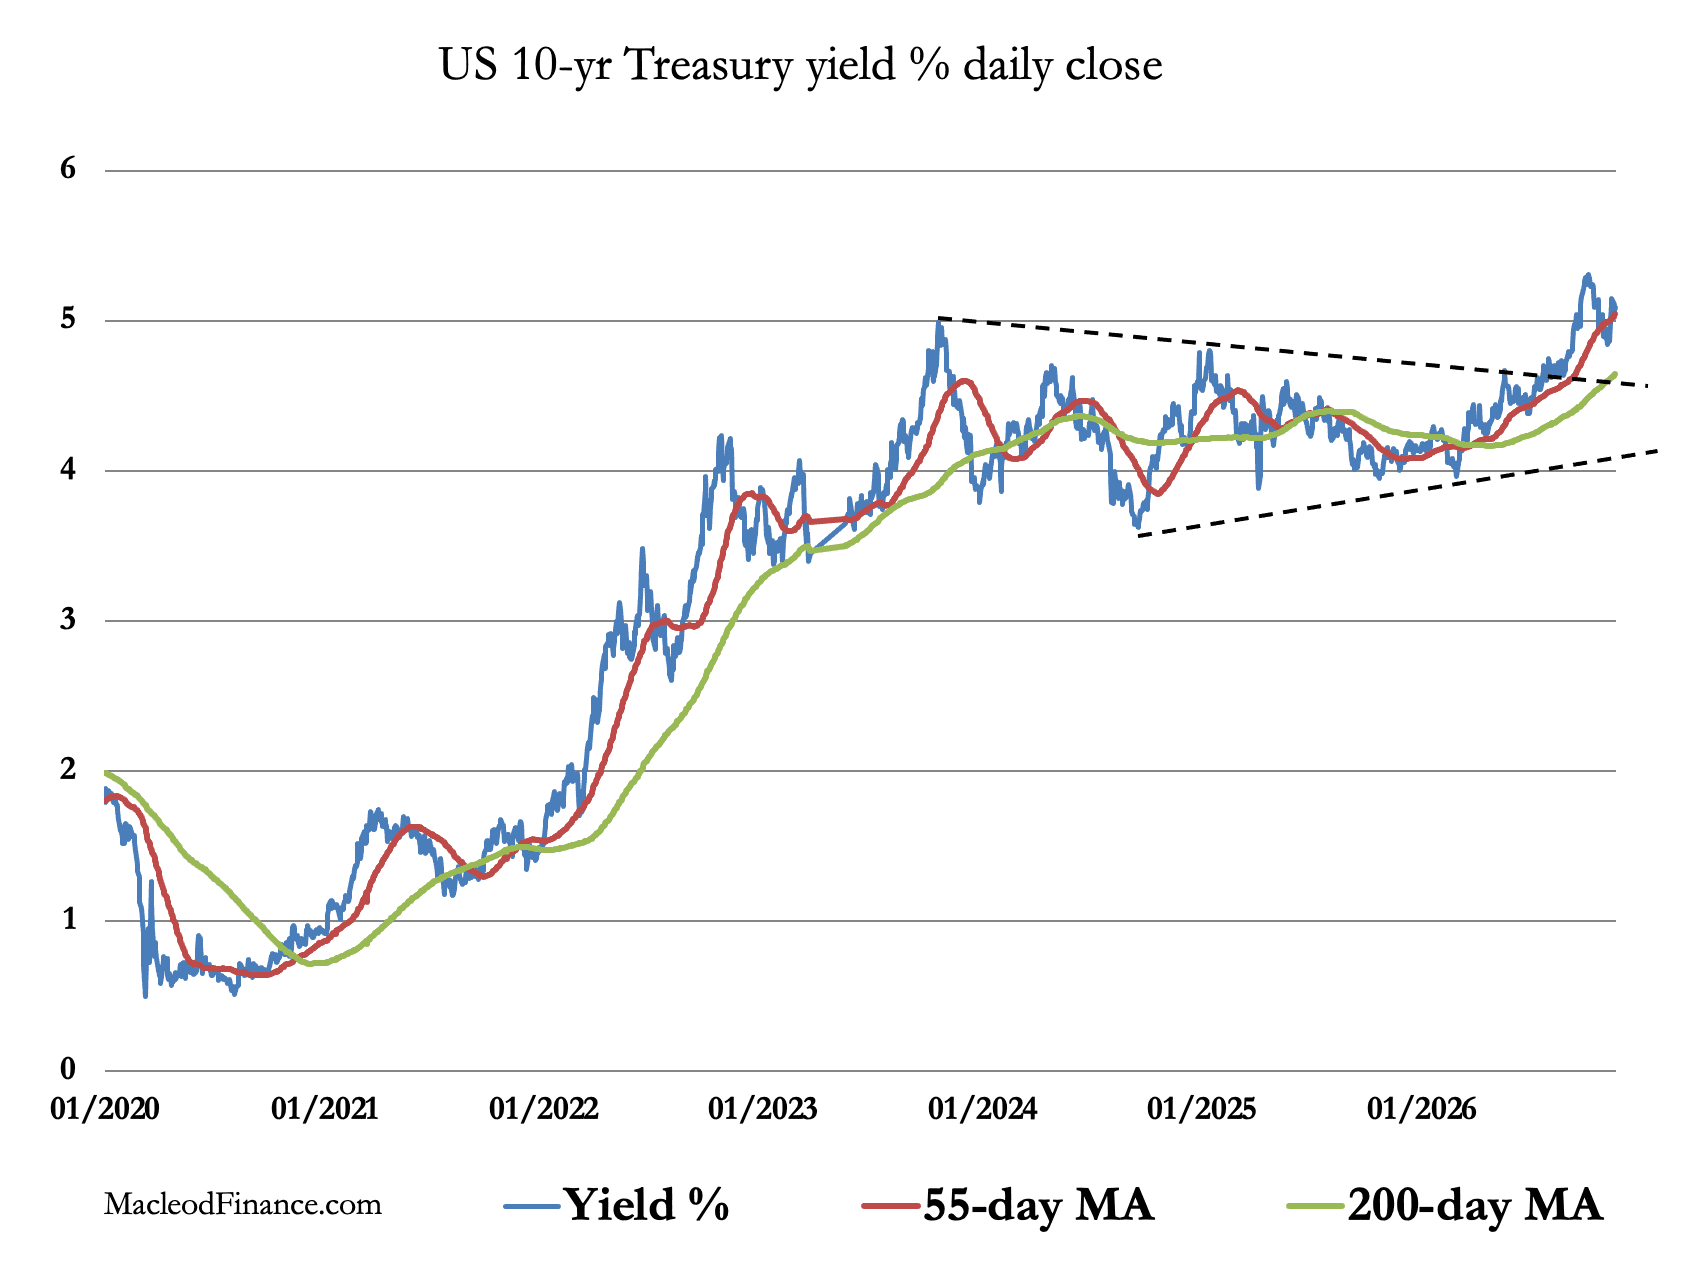
The trend is obviously going higher and for good reasons. The inflation outlook is still underestimated, and worse for the US Treasury a debt trap is emerging in its finances. The classic debt trap conditions are when government revenue fails to keep pace with debt funding costs, a condition now apparent from developments in bank lending which show an economy entering recession. There’s a horrible circularity in a debt trap: rising bond yields increase the condition requiring yet higher bond yields to discount the consequences, until the victim finally cuts its spending sufficiently to return confidence to financial markets.
Despite other consequences of a recession, a debt trap results in far higher bond yields being demanded in financial markets. This changes the risk attitudes of traders, leading to liquidity drying up, particularly in off-the-run treasuries. An off-the-run treasury is a bond which has been in existence for some time and has a settled list of holders. These are already less liquid than on-the-runs which have been recently issued. But the collateral in the $12.5 trillion repo market is mostly off-the-run treasuries.
Rises in bond yields are beginning to threaten repo liquidity, because counterparties are less keen to take in collateral, and if they haven’t already prime dealers will widen spreads in a general flight towards on-the-run quality. This is what happened in the last such event, and we need to look at the last repo crisis to see how it might play out.
The covid lockdown
Between 18th February and 23rd March 2020, the S&P500 lost 33%. The repo market seized up for the reasons outlined above. On 9th March, the yield on the 10-year treasury note fell to 0.5%, reflecting a flight out of riskier investments. But then yields began to rise, not because risk elsewhere had diminished but because they became a source of funds. And with yields rapidly rising (the 10-year yield almost doubled to 0.95% by 13th March, rising to 1.27% on 18th March) off-the-runs were not being quoted. Consequently, the Fed was forced to step in announcing that it was prepared to buy up to $500bn of treasuries and $200bn of agency debt.
At that time, the repo market was estimated to be $4 trillion. At $12.5 trillion today, the scale of a similar Fed rescue may have to be over $2 trillion. And there’s no guarantee that it will succeed.
Gold and silver
At the start of covid, along with a 33% fall in the S&P500 Index gold and silver were similarly marked down aggressively. Gold fell from $1700 on 9th March 2020 to $1453 on 16th March, subsequently rallying to $2073 on 7th August. And silver fell from $18.90 to $11.67 and then rose to $29.80 respectively.
If our thesis about financial market liquidity is correct, then the sharp declines in gold, silver, oil, and other commodities is signalling a developing crisis centring on the repo market triggered by early signs of a contraction in bank lending to non-financial businesses as they enter recession. At the same time, bond yields and the Fed funds rate are being driven higher by underestimated inflation which is the consequence of the crisis in the Middle East.
When market participants work out for themselves the consequences of this mess, they will buy gold, silver, and other commodities primarily to escape the falling purchasing power of the dollar and other currencies facing similar market dynamics.
In 1973—1974, a similar situation with respect to oil and gold played out. In late-1973, OPEC raised its reference price for oil moderately. Gold initially fell from $120 to $90 in mid-December, before rising to recover all its earlier losses by mid-January. In late-January, OPEC more than doubled its oil reference price and by early April the price of oil had doubled from its December low as well. This is illustrated below:
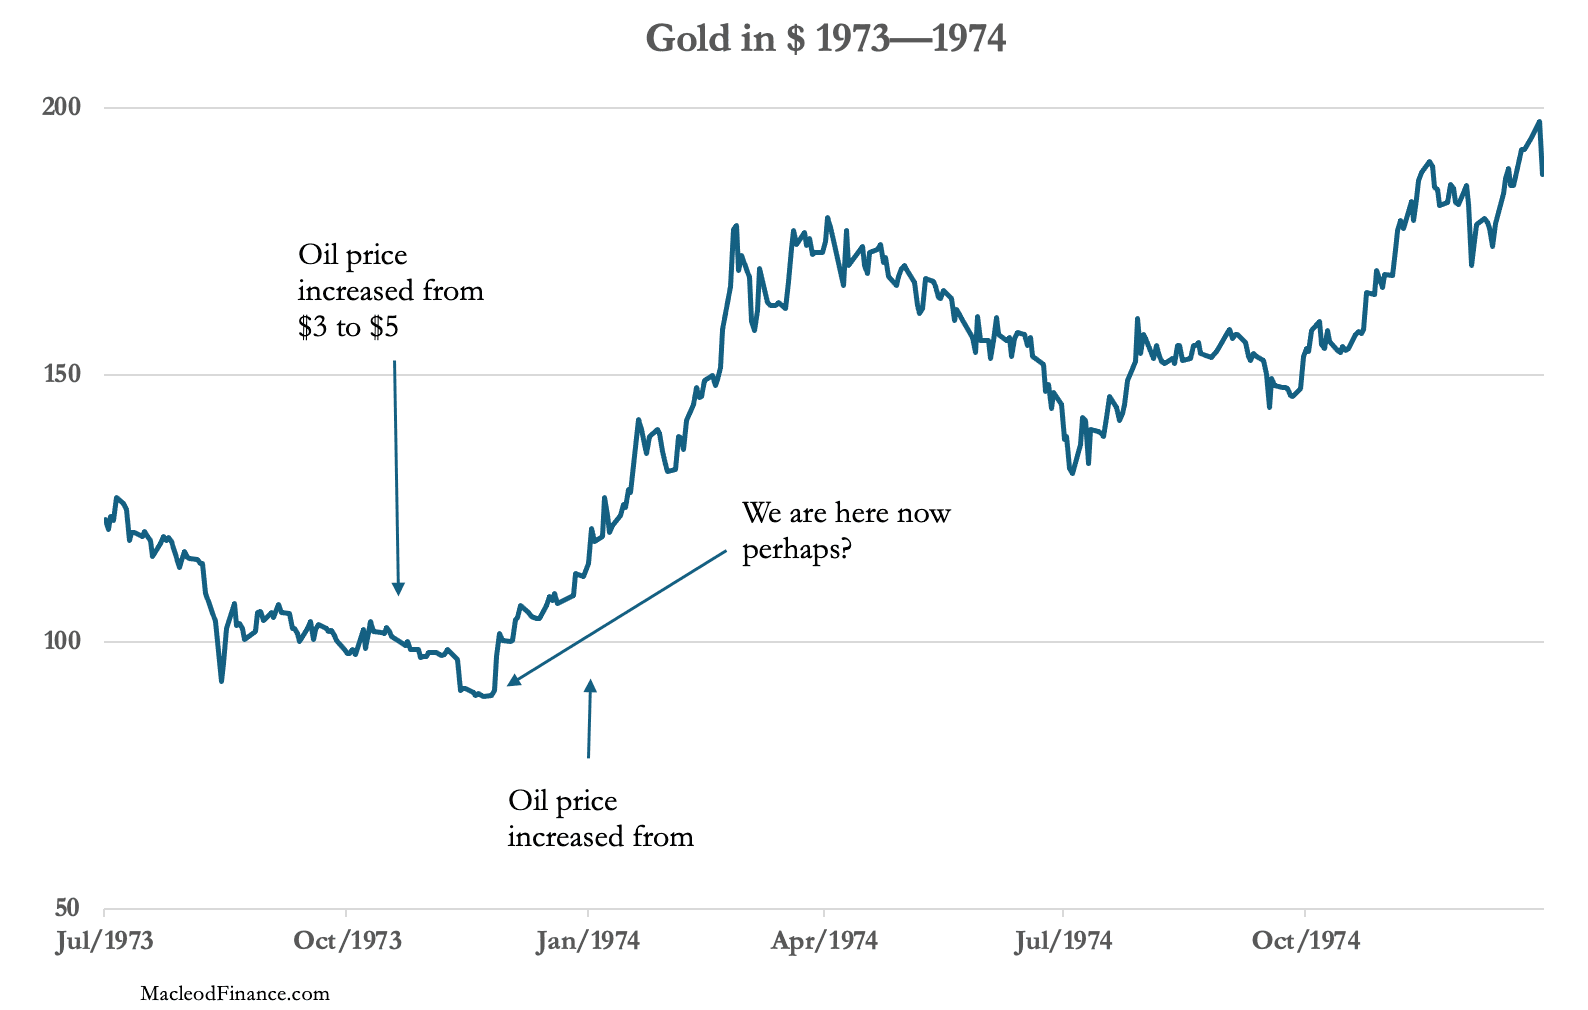
Further evidence, if it were needed of the dynamics behind a selloff in gold and silver. It is part of a discovery process that reveals the true risk is in the dollar and attendant currencies, and gold is the escape from that risk. A lesson to be relearned again.