Market Report: Punters paradox
Jul 3, 2020·Alasdair Macleod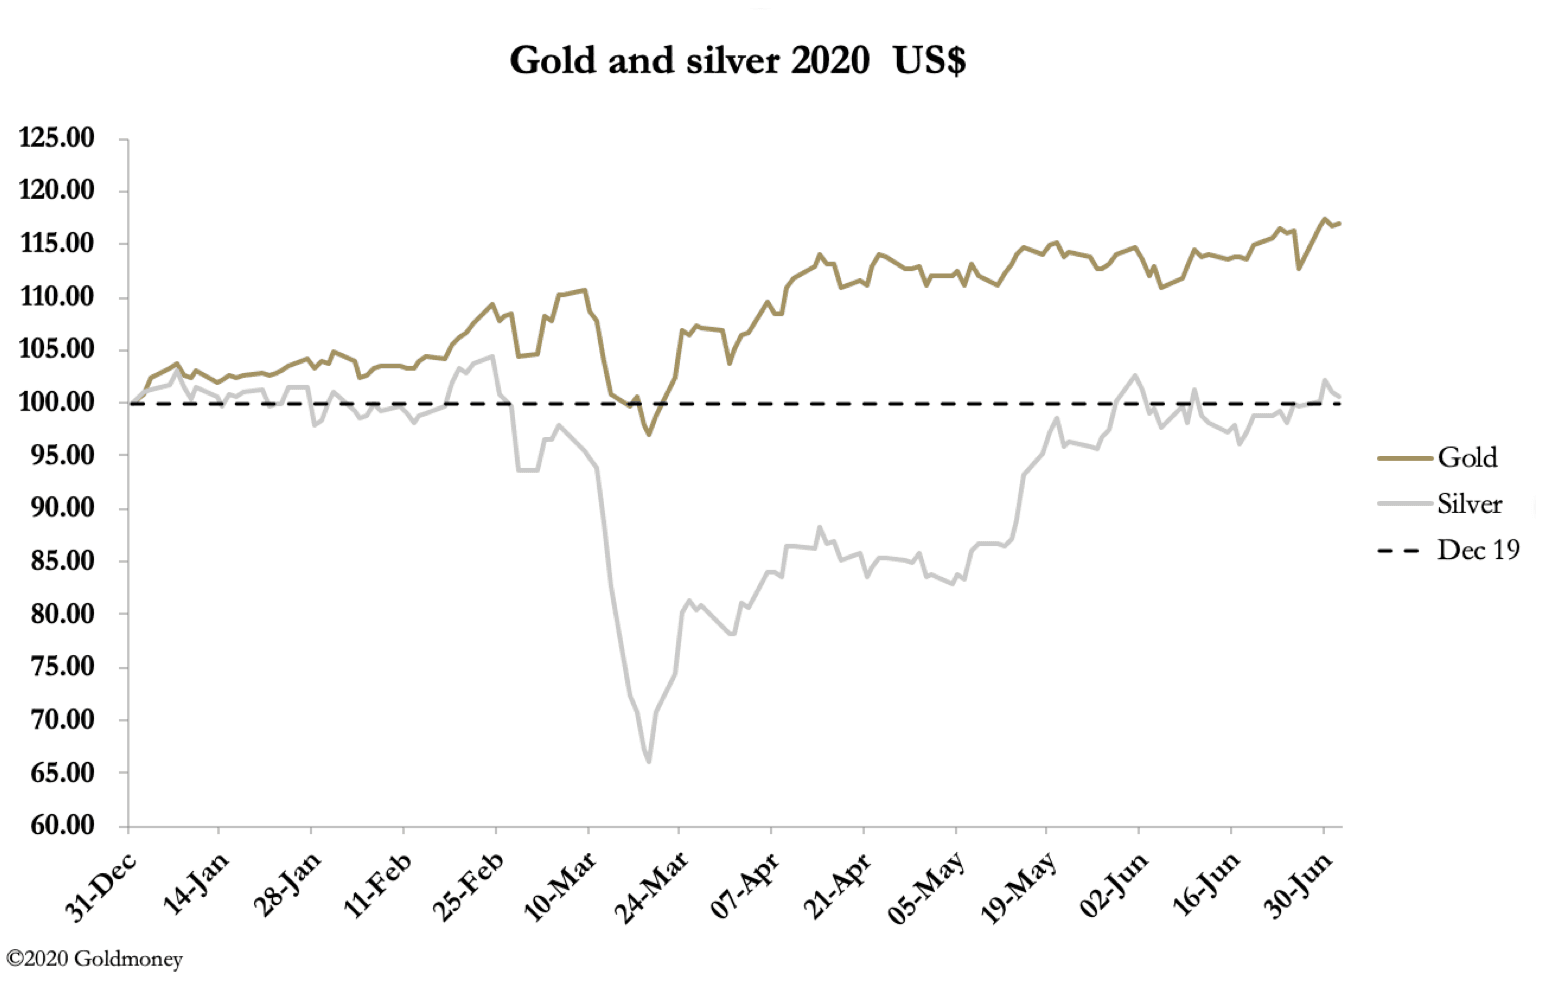
After hitting new eight-year highs on Tuesday gold backed off. By morning trade in Europe today, gold was up $4 on the week at $1775 having traded at $1789, and silver up 24 cents at $17.99 having traded at $18.44.
The punters paradox referred to above is the contrast between their various indicators which warn them everyone is bullish on gold mines and the gold price. These are the conditions the swaps — bullion bank trading desks — normally prey for, allowing them to create a cascade of disappointed sellers by triggering their stops.
It has worked every time since the Comex gold contract moved from being a simple hedge against long positions on the LBMA to an easy way for bullion banks to make trading profits. The power imbalance is bullion banks can always expand credit to maintain positions, whereas the managed money category, speculating hedge funds in the main, cannot. And they weaken their position further by only being interested in a short-term trade, never encumbered by taking delivery.
Recently this predictive model began to change. In late-July last year, gold’s open interest on Comex tested new high ground. This is marked by the first set of arrows on our next chart.
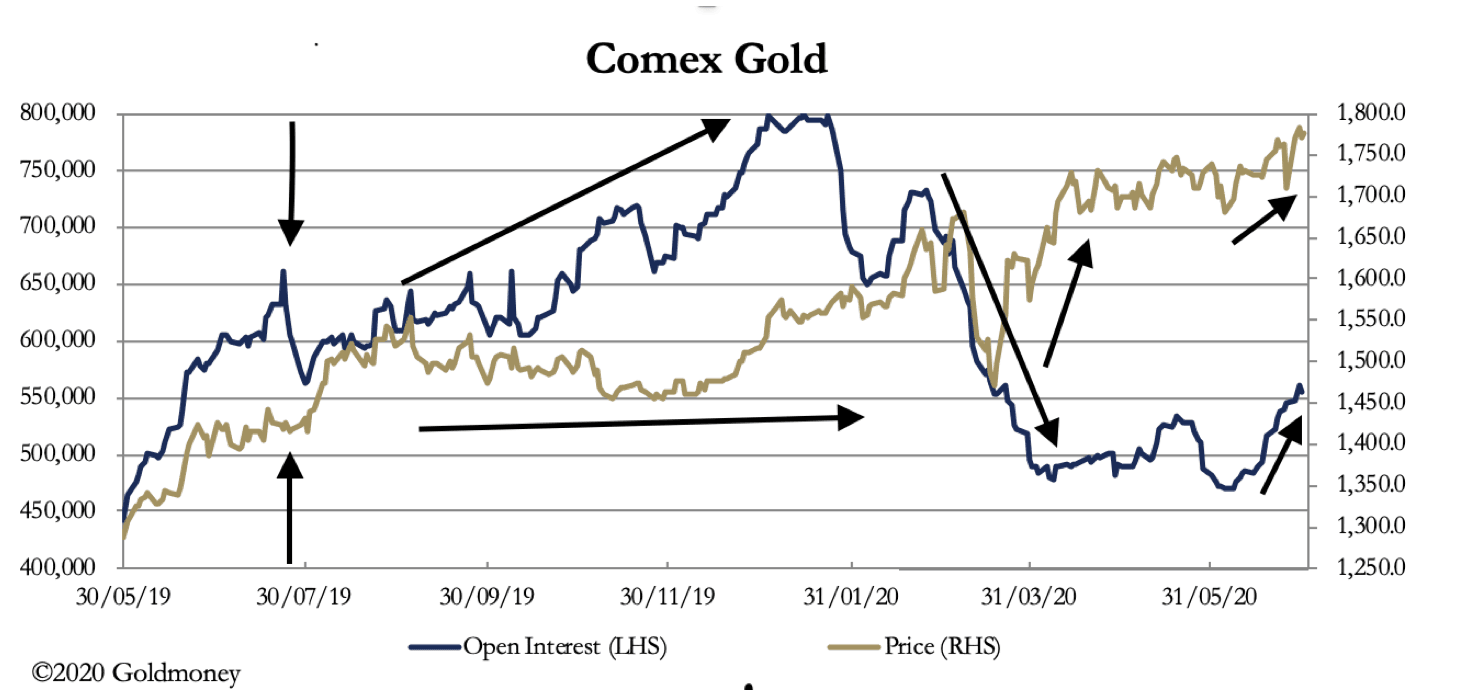
Following that high point for open interest, it contracted, pushed by the bullion banks, but the price failed to track down with it. There was a rotation on the buy side, with managed money reducing their longs as planned, but the gold price remained steady before moving up from $1420 to test $1500 in September. This was the first sign that price control was moving away from bullion banks on Comex.
The second set of arrows shows how between September and January open interest grew to record levels as bullion banks, still heavily short and getting increasingly so, absorbed demand and put a lid on the gold price, which moved sideways before moving higher to $1575. At this point the bullion banks panicked and in a joint operation acted to take the steam out of the gold price — the third set of arrows. They crashed the market, taking open interest down from nearly 800,000 contracts to 480,000 at the beginning of April. But while the gold price initially went with this contraction, on 19 March gold turned from $1470 and shot upwards to over $1700. The gap between Comex and London spot widened as the exchange for physical market, which acts as arbitrageur between the two, collapsed under the stresses.
The last set of arrows shows open interest picking up again, but from low levels, while the prices chip away at new 8-year highs. The swaps are now record net short at $28.4bn. And some in the speculator category stood for delivery of 171 tonnes when the June contract died.
Clearly, things have changed, and the punters cannot rely on regular bullion bank price smashes to inform their timing. It will be very interesting to see how the Comex contract evolves from here, given that later this month the August contract might just repeat the horrors — for bullion banks that is — of standing for delivery.
The views and opinions expressed in this article are those of the author(s) and do not reflect those of Goldmoney, unless expressly stated. The article is for general information purposes only and does not constitute either Goldmoney or the author(s) providing you with legal, financial, tax, investment, or accounting advice. You should not act or rely on any information contained in the article without first seeking independent professional advice. Care has been taken to ensure that the information in the article is reliable; however, Goldmoney does not represent that it is accurate, complete, up-to-date and/or to be taken as an indication of future results and it should not be relied upon as such. Goldmoney will not be held responsible for any claim, loss, damage, or inconvenience caused as a result of any information or opinion contained in this article and any action taken as a result of the opinions and information contained in this article is at your own risk.