Silver on the verge of a break out
Apr 18, 2018·Stefan WielerSilver prices are trading almost 25% below the values predicted by our price model. This is the largest downside deviation we have seen in over 25 years. We believe this is the result of massive short selling in the futures market. In order to maintain this downward pressure on silver, speculators would have to continue to sell over 500 million ounces of paper silver per year. A reversal of this positioning could lead a >30% rally in silver prices in our view.
View the Entire Research Piece as a PDF here.
About a year ago we introduced our Silver Price Framework (see Silver price framework: Both money and a commodity, March 9, 2017). In that report, we highlighted that silver prices are driven by monetary demand as well as supply and demand for industrial purposes, the latter of which being an important differentiator to how gold prices form.
More specifically, we found that:
1. Silver is, like gold, a commodity store of value and is free of counterparty risk, with energy-intensive replacement costs setting the lower boundary for prices (the same energy proof of value that underlies gold prices). As such, silver should be impacted by the same monetary drivers as gold prices: real-interest rate expectations, central bank policy, and longer-dated energy prices.
2. As silver is a commodity with extensive industrial applications, changes in industrial drivers (i.e. changes in available inventories) should impact the price of the metal.
We find that a large part of the changes in the price of silver can be explained in a regression analysis using just a few drivers: gold prices, TIPS yields, and changes in silver ETF holdings (representing the monetary demand for silver) as well as U.S. industrial production and the ISM manufacturing PMI (the industrial demand for silver). Indeed, these drivers explain close to 80% of the year-over-year changes in silver prices in a multi-variate regression analysis.
Silver prices are currently much lower than they should be
Putting our proprietary silver model to use, we find that silver prices are currently severely undervalued relative to gold (see Exhibit 1). The model shows the highest upside discrepancy between predicted and actual prices over the entire modeling period, both in relative and absolute measures. In relative terms, silver prices are currently 25% below the predicted values. In absolute terms, silver prices are USD5.05/ozt below predicted values (see Exhibit 2).
Speculators have placed record short bets on silver in the futures markets.
Most trade activity in silver futures is done at the Commodity Mercantile Exchange (COMEX) in New York. Unlike other commodity futures markets, there is a level of transparency in U.S. exchanges. The Commodity Futures Trading Commission (CFTC) requires commodity exchanges to report positions on a weekly basis in the Commitments of Traders (COT) report. This data is publicly available and is published each Friday containing data up to the Tuesday of the respective week. The COT data contains long and short positions for both futures and options for four different categories:
1. Producer/Merchant/Processor/Use
2. Swap Dealers
3. Managed Money
4. Other Reportables
Producer/Merchant/Processor/User are players in the physical space which use the futures market to hedge their physical positions. According to the CFTC, a “producer/merchant/processor/user” is an entity that predominantly “engages in the production, processing, packing or handling of a physical commodity and uses the futures markets to manage or hedge risks associated with those activities.” However, plenty of physical players hold positions for speculative purposes as well, and the CFTC is well aware that these speculative positions might end up in this category. Unfortunately, we cannot separate the parts of those positions which are for true hedging purposes, and parts that are purely trading. This is why trading positions from merchants and producers are not accounted in net speculative positions.
The CFTC defines Other Reportables as “every other reportable trader that is not placed into one of the other three categories”. There are many small speculators in this category, however, we can’t break them out. Consequently, we do not consider these positions speculative positions.
Swap Dealers are, according to the CFTC, “entities that deals primarily in swaps for a commodity and uses the futures markets to manage or hedge the risk associated with those swaps transactions. The swap dealer’s counterparties may be speculative traders, like hedge funds, or traditional commercial clients that are managing risk arising from their dealings in the physical commodity.” In other words, these are banks that enter positions for clients. In our experience, swap dealer positions also reflect to a large extent positions of passive investors such as pension funds. While these types of investors also don’t have a physical position to offset, they usually don’t trade on price expectations either. Instead, passive investors tend to be in commodities for either portfolio diversification reasons or as a hedge and against commodity price spikes which would impact other assets in their portfolios. Passive investors are by nature long only investors and they are very slow to adjust positions. Usually a passive investor has a strategic allocation to commodities which tends to remain unchanged for years. Hence, when trying to identify speculative positions, we are not including swap dealers. However, this means that positions from Hedge Funds using index products are not accounted for.
This leaves us with Money Managers. The CFTC defines a money manager as a “registered commodity trading advisor (CTA); a registered commodity pool operator (CPO); or an unregistered fund identified by CFTC. These traders are engaged in managing and conducting organized futures trading on behalf of clients.” In the industry, Money Manager positions are considered as “speculative” positions as they contains positions of Hedge Funds and CTAs. These players usually don’t have a physical long or short position to hedge, but instead position themselves solely on their price expectations. With silver, we see that Money Manager net short positions have reached an all-time low of -200 million ounces as of last week. More importantly, the net flows show an unprecedented level of selling, with over 600 million ounces of silver sold over the last 12 months (see Exhibit 4).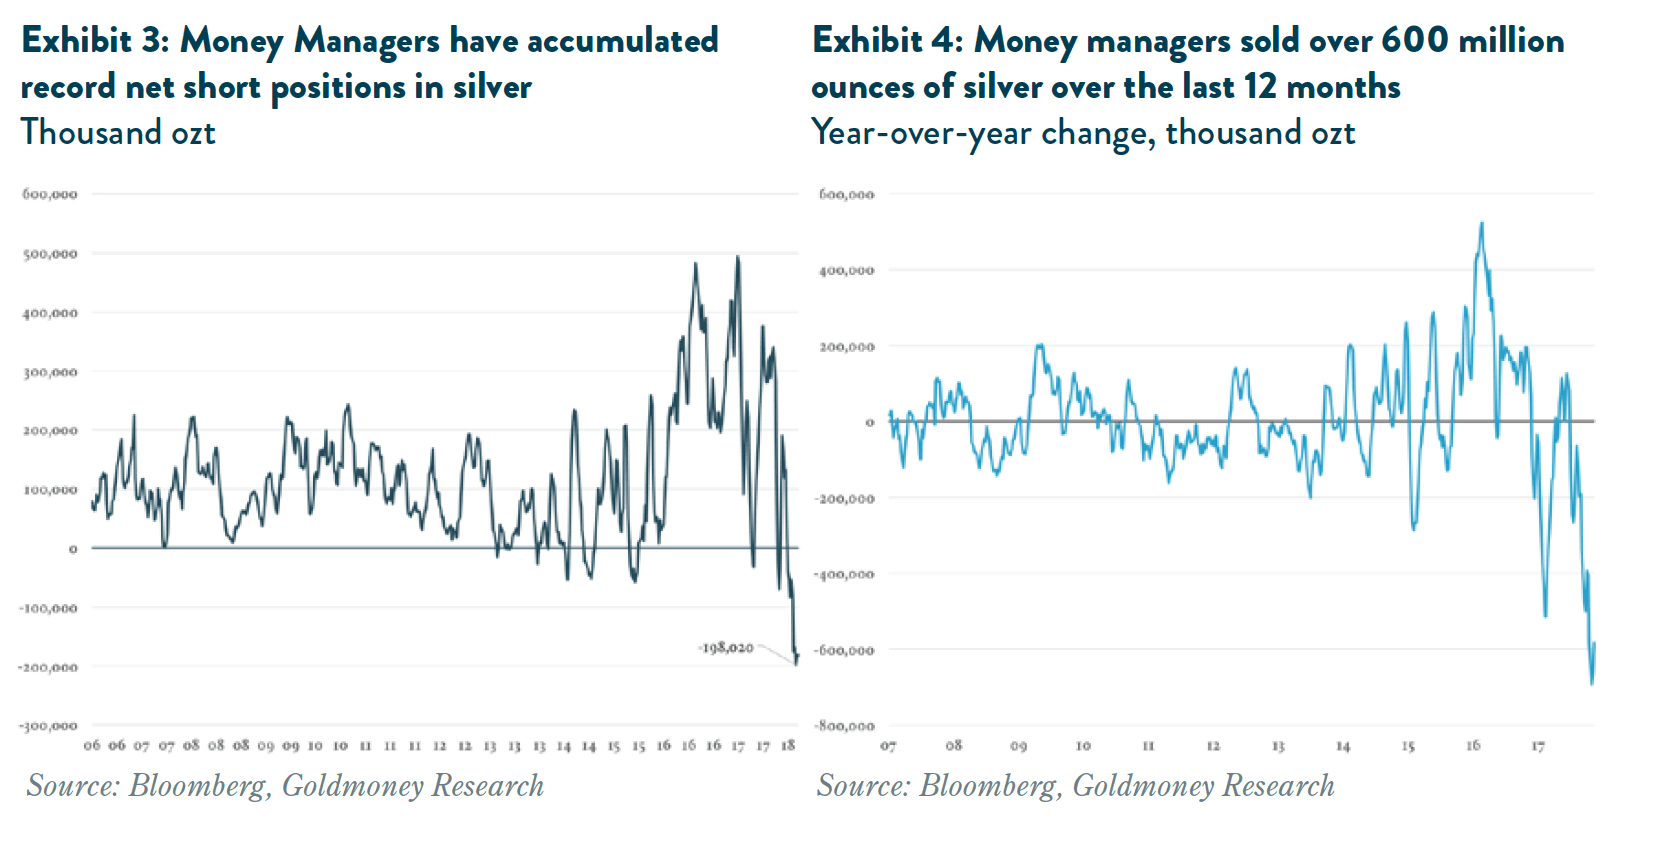
Unfortunately, the CFTC started to report the data in this disaggregated form only since June 2006, limiting historical context. However, the CFTC has been reporting positioning data on silver already since March 1995. While having a much longer data history, this original data is less fragmented. There are only three categories: Commercials, non-commercials and non-reportable. We thus call the original CFTC reporting the “aggregated” data (vs the new reporting as disaggregated data). Theoretically, in the aggregated data, commercials are supposed to be producers or consumers of a commodity who entered a futures position in order to hedge the risk of a physical position, while any position of a non-hedger has no physical counterpart. This is why commercials in the aggregated data are often referred to as hedgers, while non-commercials are speculators. Net positions of non-commercials are typically referred to as net specs.
The reality is a bit more complicated. As we have outlined above, it is useful to differentiate between true speculators and passive investors. The aggregated data does not allow that, both passive and active investors are considered speculators. Further complications arise when a position can be shown in the hedging bucket or the speculative bucket, depending on how it was entered. For example, a pension fund that wants to put on a long oil position would historically go to an investment bank which sells the fund an index swap. The pension fund itself is not long a future – it’s long an index which will reflect the performance of a rolling future position. Its counterparty is not the exchange, but the bank. The bank in turn is short a synthetic rolling futures position. Hence the bank will enter a long futures position to hedge that risk. The CFTC would categorize the bank as a hedger, because it hedges that risk. But there is no physical hedging. This is important to note because over the past years, we’ve seen a shift by large institutional investors from investing in index products to taking futures positions directly. Hence, the same trade would now be considered speculative rather than a hedge. Ironically, the institutional investors often still deal through the same investment banks, just with a different unit. But the bank simply offers the passive investor the platform and is not taking positions in the futures market itself.
The new improved reporting method is not entirely free of the problems highlighted above either, but the issues are amplified in the aggregated data. Hence, historical levels of “speculative” positions have to be taken with a grain of salt. Importantly, the issues described above have led to a gradual increase in net speculative positions in commodities because passive investors increasingly appear in the non-hedger category. This gives the wrong appearance that speculative positions in commodities are much higher now than 10 years ago while in reality it’s just an accounting phenomenon.
Consequently, a record speculative net short position in silver today reflects a much more bearish positioning by actual speculators than it did in the past, which is exactly what we are seeing now. Net specs in the aggregated data have also reached an all-time low, with 92 million ounces of net shorts (see Exhibit 5). More importantly, the change in positioning is again unprecedented. Over the past 12 months, speculators sold over 600 million ounces of silver in the futures market. This exceeds the previous record three times since the data began in 1990 (see Exhibit 6).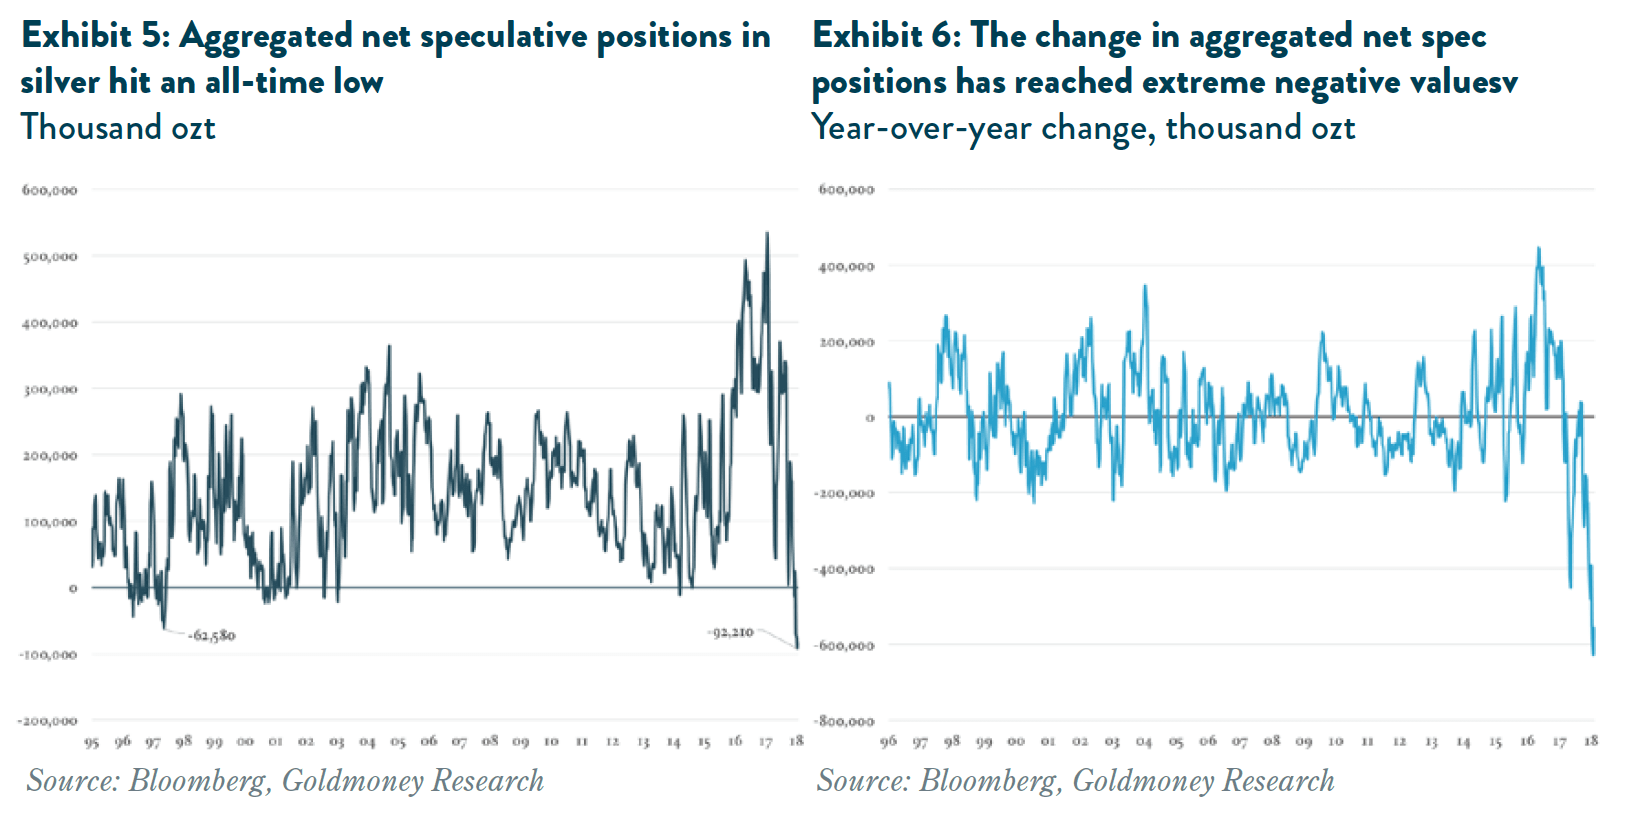
In our view, it was this relentless selling pressure in the futures market that is depressing silver prices. In order for this to continue, speculators would have to continue to net sell over 500 million ounces in the futures market per year. However, historically, changes in net spec positions have always reverted to the mean. We believe that even reduced net selling would allow silver prices to move closer to the model-predicted value. In a more balanced spec market, meaning buy and sell flows offset each other, silver prices should return to the model-predicted value of USD21/ozt, which is 30% higher from here. However, this would put enormous pressure on the shorts to cover their positions, which would likely result in increasing net spec positions rather than balanced flows. In this scenario we could see explosive price action in silver.
The views and opinions expressed in this article are those of the author(s) and do not reflect those of Goldmoney, unless expressly stated. The article is for general information purposes only and does not constitute either Goldmoney or the author(s) providing you with legal, financial, tax, investment, or accounting advice. You should not act or rely on any information contained in the article without first seeking independent professional advice. Care has been taken to ensure that the information in the article is reliable; however, Goldmoney does not represent that it is accurate, complete, up-to-date and/or to be taken as an indication of future results and it should not be relied upon as such. Goldmoney will not be held responsible for any claim, loss, damage, or inconvenience caused as a result of any information or opinion contained in this article and any action taken as a result of the opinions and information contained in this article is at your own risk.