The equity-gold price conundrum – Part II
Mar 19, 2021·Goldmoney InsightsEquity markets have relentlessly rallied over the past 12 months, pushing valuations to extreme levels based on traditional metrics. In this report, we analyze the two common arguments by equity bulls why this time is different and current valuations are justified. We find that markets are either currently mispricing gold or equities, as either of these arguments would imply that gold should outperform stocks.
This is a two-part report in which we analyze the dichotomy between current equity prices – which by conventional valuation metrics look extremely overvalued - and gold. In the first part of this report (see The equity-gold price conundrum – Part I, March 08, 2021), we identified the two common arguments put forward by the equity bulls why these valuations are justified:
1. The great Gatsby: The pandemic, as negative as it was for economic activity near term, will be followed by a period of unprecedented economic expansion. Hence, the GDP will rapidly rise and close the gap to equity prices.
2. The great inflation: Stock simply price in future inflation that eventually will come on the back of decades of ultra-low rates and central bank balance sheet expansion
We then took a closer look at the first argument: Proponents of the great Gatsby scenario argue that, once the COVID19 pandemic is behind us, as enough people are vaccinated and normality returns, economic activity will explode. However, we found that in order to close the gap between GDP and equity prices, the US would have to undergo a prolonged period of very high real economic expansion. Given the extent of this expansionary period, there is only one precedent since the end of WWII, and when that started, the US economy was in a significantly better starting position. Therefore, for the great Gatsby scenario to play out, substantial monetary and economic stimulus (infrastructure programs and potentially UBI) would be necessary[1]. However, these programs would have to be entirely debt financed.
Thus, the equity-gold conundrum doesn’t disappear in the great Gatsby scenario. In fact, we think that if we see strong economic growth over the coming years, it will entirely be debt-financed and, as a consequence, gold should outperform stocks, not the other way around
Exhibit 1: The equities-to-gold price ratio has increased amidst the global COVID pandemic
S&P500 $ / Gold $/ozt

Source: Goldmoney research
In this second part of the report, we look at the other possible justification for current stock prices – the great inflation scenario – and explore the viability of stocks outperforming gold in such an environment.
This scenario seems intuitive at first sight. As we have highlighted before, prior to the outbreak of the COVID pandemic, the US economy, and by proxy the world economy, began to stutter and heavy intervention from the FED was needed to get the repo market under control. The Fed had slashed rates from 2.5% in July 2019 to 1.75% by December, before COVID19 ever hit the news. 10-year treasury rates dropped from over 3% to 1.5% over the same period (see exhibit 2).
Exhibit 2: The US economy started to look frothy by mid-2019, forcing the Fed to reverse course %

Source: FRED, Goldmoney Research
Back then, we concluded that the hike cycle had ended and that we would probably soon see new lows in real-interest rate expectations and a new high in the Feds balance sheet. What followed was truly unprecedented. The global COVID19 pandemic and the ensuing lockdowns sent asset prices spiraling and economic output contracted at its fastest pace in history. The Fed did not hesitate and slashed rates to zero. More importantly, it aggressively increased its balance sheet.
From the end of February to the end of May 2020, the Fed added $3tn in assets to its balance sheet. Other central banks followed. The ECB for example added EUR2.4tn to its balance sheet since March 2020.
Exhibit 3: Both the Fed and the ECB sharply increased their QE
$ mn Fed, EUR mn ECB

Source: Bloomberg, Goldmoney research
This pushed real-interest rate expectations sharply lower, with 10-years TIPs yields falling below -1% for the first time. While inflation expectations took an initial hit when the pandemic unfolded, dropping to almost 0.5% (10y breakeven), they soon climbed back and are currently at 2.2% (see exhibit 3).
Exhibit 3: Breakeven inflation expectations initially dropped sharply but are now back to over 2%
% 10-year TIPS yields

Source: FRED, Goldmoney research
One of the main differences between the great Gatsby scenario and the great inflation scenario is time. Real economic growth in one year is limited, but nominal growth due to inflation is not. In the first part of this report, we asked:
Even with a staggering 5% annual GDP growth and 2% inflation, it would still take more than seven years to get there. Are stocks really pricing in the year 2028 with 0% discount rate?
As we have demonstrated, there has hardly been any prolonged period with real growth at over 5%. However, in the 1970s, there were several years in the US with double-digit nominal GDP growth due to high inflation. Outside the US, there are plenty of examples where nominal GDP grew much faster than 5% as the currency rapidly devalued. Thus, in our view the great inflation scenario is better suited to explain current equity prices than the great Gatsby scenario. But does it solve the equity-gold price conundrum? In other words, should equities outperform gold on the cusp of a major inflationary period?
First of all, it’s important to get an idea on how much inflation would be needed to bring current equity prices back in line with historical valuations. One way to estimate this is to look at what level of nominal GDP is needed to bring total market cap to GDP back to reasonable levels. As a reminder, in part one of this report, we showed that total market cap to GDP stands at a staggering 193%. Historically, the average “sustainable” total market cap to GDP was around 100% (it was 120% over the past 10 years).
Arguably, current GDP is heavily impacted by the lockdowns. So for the sake of the argument, let’s assume that the US nominal GDP returns back to pre-covid levels once the economy reopens[2]. In that case, the US GDP would start at $21.4tn. Hence, nominal GDP would have to increase by 86% to bring the total market cap to GDP ratio back to 100% ($40tn), or by 63% to bring it to 120% ($35tn). Let us also assume that the US economy grows by 2% in real terms over the long run once it has returned to pre-covid levels. Over a period of 5 years, that would bring the nominal GDP to just $23.6tn. That means, it is up for inflation to fill the gap. Thus, inflation would have to be averaging at 10% to bring equity prices in line with GDP in 5 years. And that would require equity prices to stay flat for the next 5 years. Are equity markets that forward-looking? How much inflation is needed to get stock prices back in line over a shorter period of time? The table below gives an answer.

Source: Goldmoney research
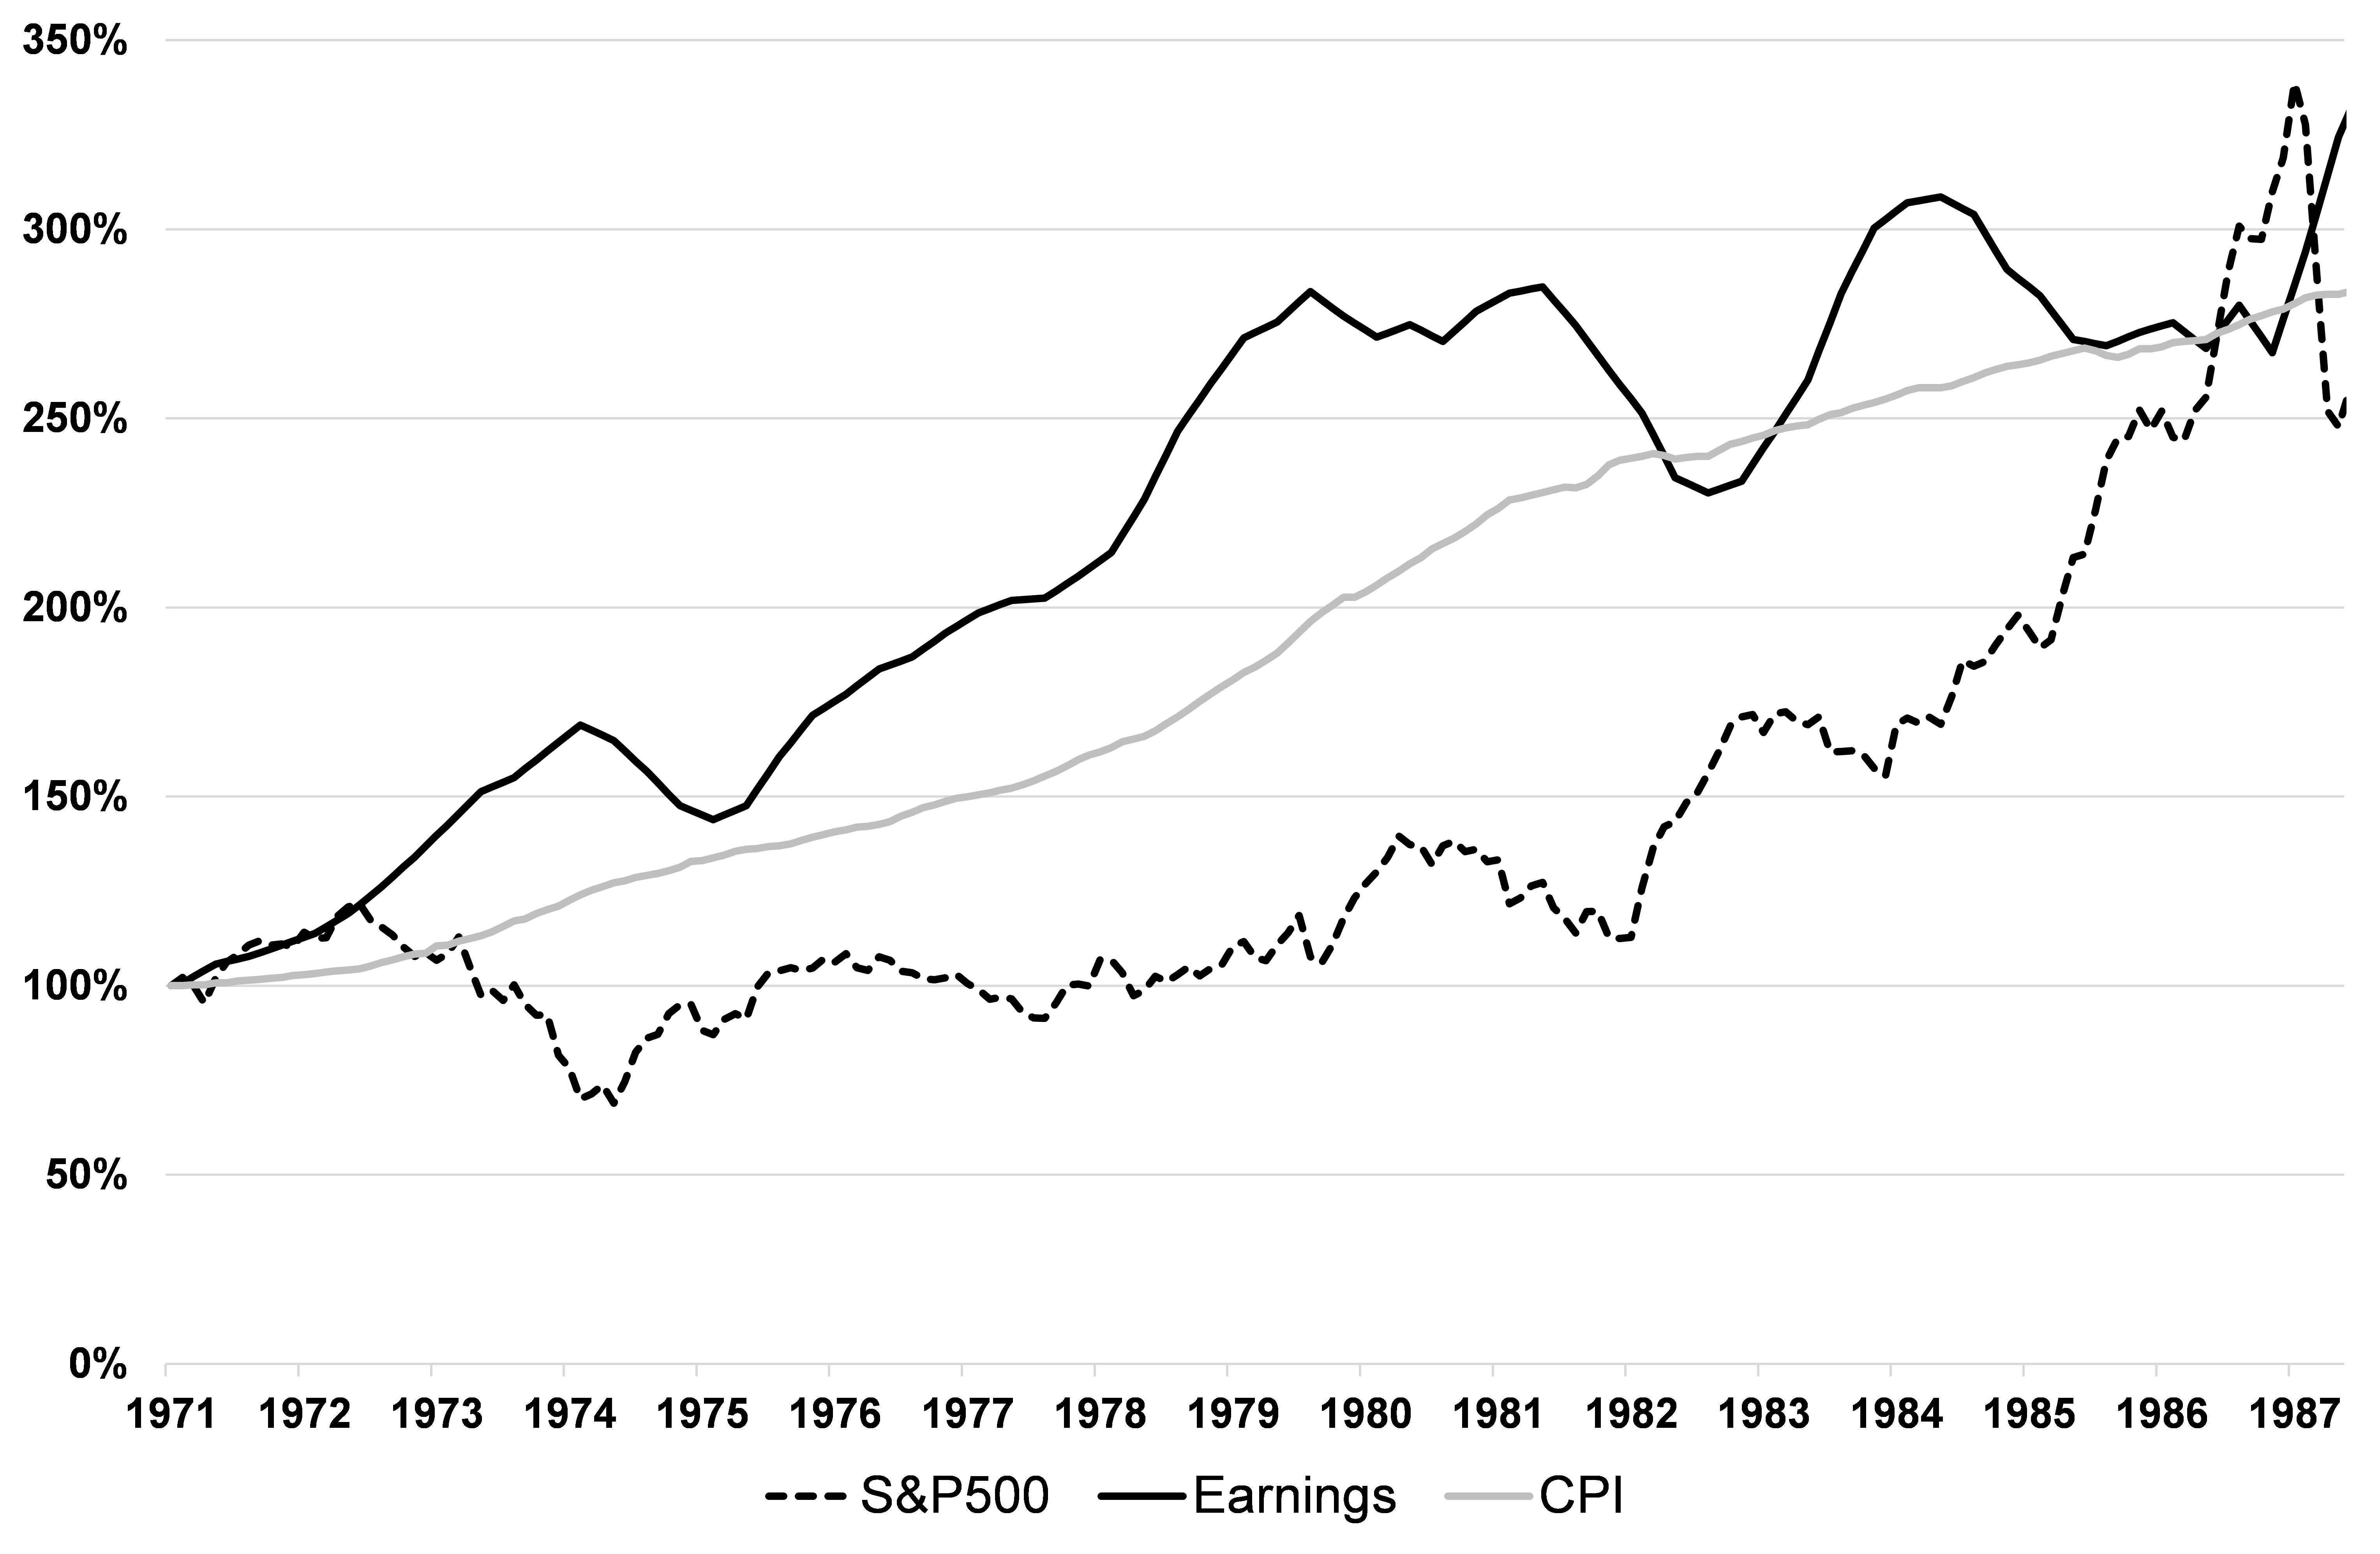
As a result, in order for equity valuation to make sense even over the long run, VERY high inflation has to occur. However, when we look back at previous episodes of high inflation, we find that equities did not protect investors from inflation that well. After President Nixon temporarily suspended the convertibility of the USD to gold in 1971, de facto ending the gold standard, the US entered a prolonged period of very high inflation that only ended in the early 1980s. Corporate revenues rose with inflation, but stock prices lagged. In fact, it took stock prices 17 years to catch up with inflation (see Exhibit 2)
Exhibit 2: While corporate earnings rose with inflation in the 1970s, stock prices lagged
 Source: FRED Goldmoney Research
Thus, investing in stocks has historically not been a great way to protect against very high forward inflation. Gold on the other hand is leading inflation. As for the equities to gold ratio in high inflationary periods, It took the S&P500 27 years from 1971 to pick up with gold (see exhibit 4)
Exhibit 4: Gold was pricing in future inflation much more efficiently than stocks during the 1970s
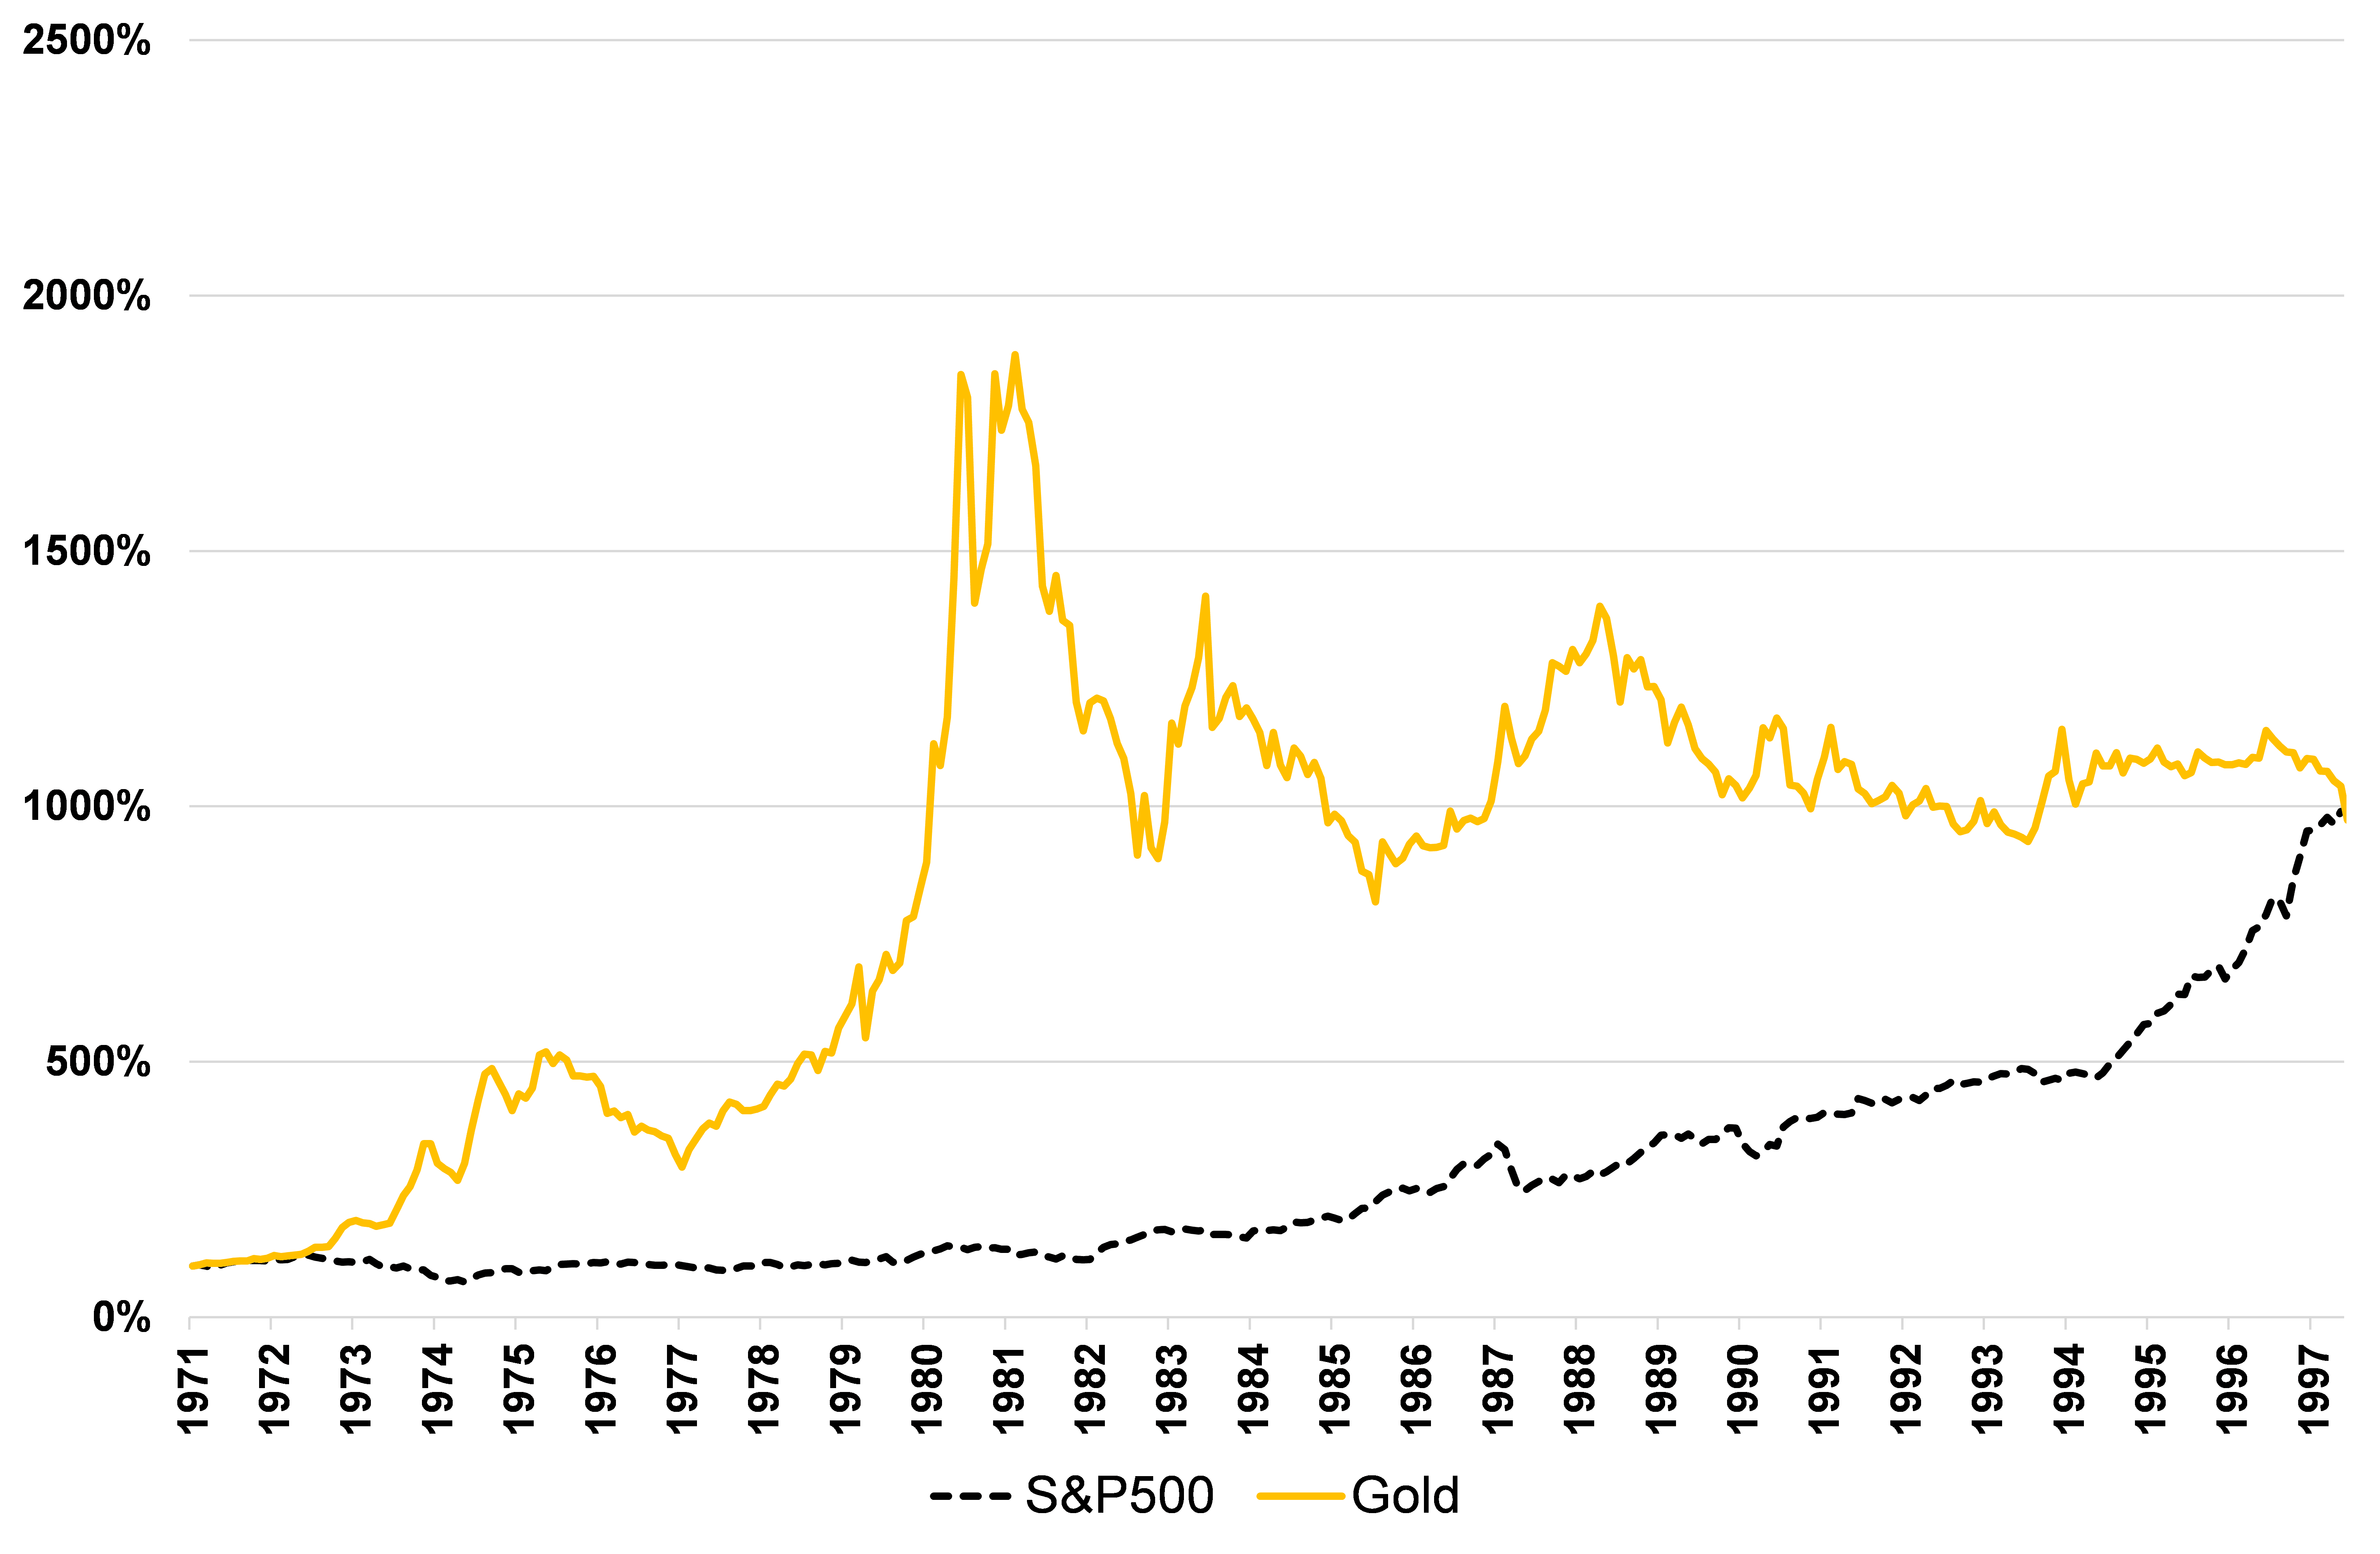 Source: Bloomberg, Goldmoney Research
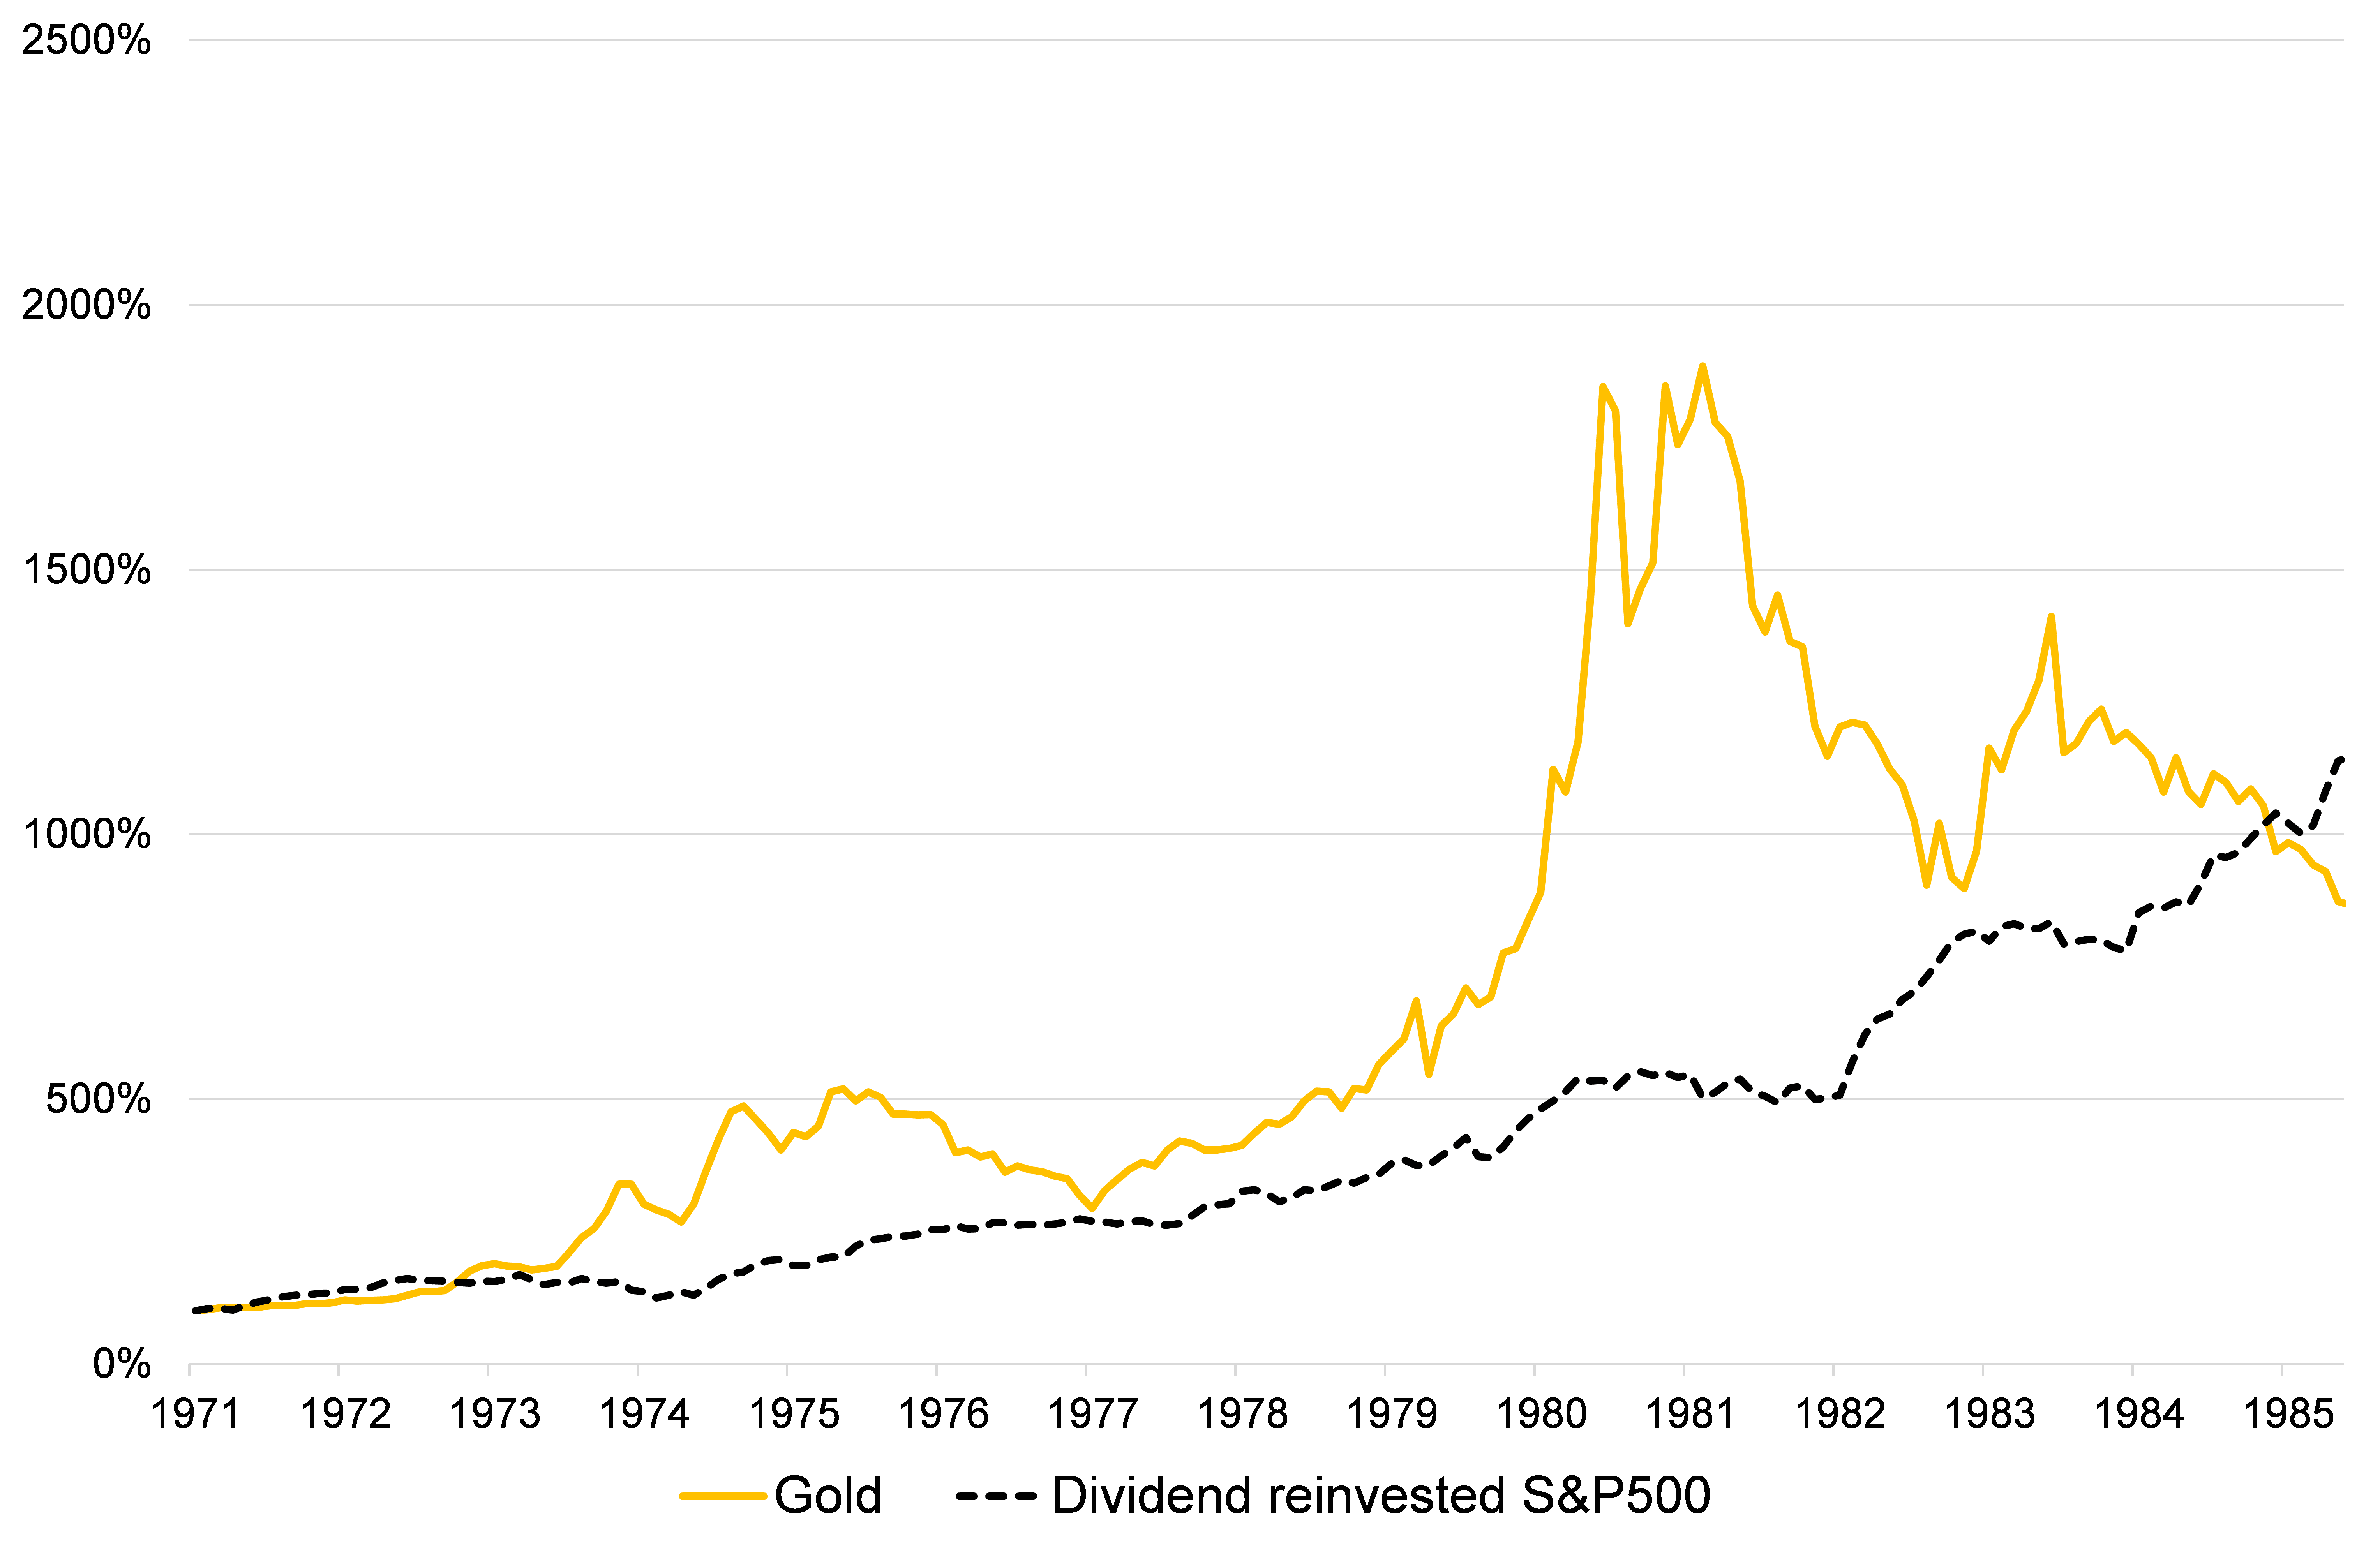
Arguably, stocks also pay dividends, so it would be unfair to just compare prices. But even when we take dividends into account, the SP500 massively underperformed gold both in the run up to and during the double digit inflation year (see exhibit 5).[3] When inflation peaked in the early 1980s, gold had outperformed dividend reinvested stocks by a staggering 1500%. It would take equities with reinvested dividends a full 14 years to fully catch up with gold, despite gold prices declining sharply form their peaks as Fed chairman Volker aggressively raised rates to over 20% to combat inflation.
Exhibit 5: Even with reinvested dividends, equities massively underperformed gold in the 1970s inflation
 Arguably, even though inflation and inflation expectations picked up recently, until now we actually have not seen the unprecedented monetary policy of the past 12 months to translate into an equal move in consumer price inflation. Instead, it led almost exclusively to asset price inflation. This is very different from the 1970s, which saw staggering price inflation in all goods and services. Should gold still outperform stocks in such a scenario?
We do have a historical example of a monetary environment that primarily led to asset price inflation with relatively benign consumer price inflation as measured by the CPI. That is the period of extreme monetary policy since the great financial crisis. The Fed began cutting the its funds rate in September 2007 as the subprime mortgage crisis unfolded. From September 2008 onwards, it was aggressively expanding its balance sheet. By December 2008, it had slashed rates to zero.
We find that gold outperformed stocks from any of these starting points for at least 4 years (see Exhibit 5). In fact, when measured from the first time the Fed cut rates in 2007, gold outperformed stocks for 11 years.
Exhibit 5: Gold outperformed stocks (S&P500) in an environment where inflation was primarily occurring in asset prices
 Source: Goldmoney Research
To summarize:
1. We find the great Gatsby scenario of an explosion in real economic growth over the coming years implausible, unless it is on the back of huge infrastructure spending, entirely financed through an unprecedented expansion in debt. However, such a debt expansion would favor gold over stocks.
2. We find the great inflation scenario is plausible, but in this scenario too, we expect gold to outperform stocks
3. Should neither scenario occur, then stocks are due for a significant correction. This would ultimately again force the Fed to intervene, which would also favor gold (however, the initial correction in equities may also negatively affect gold prices, but much less so, and only for a brief period).Thus, in our view, while timing remains challenging, we expect gold to outperform stocks over the next few years.
[1] Whether that would be sufficient is a different question
[2] As we have outlined before, there is plenty of reason to argue why this will probably not be the case.
[3] We assumed that dividends are taxed at the current 22% and applied minimal costs for brokerage fees and potentially management fees of 25bps per year. True costs to maintain a portfolio closely mimicking the S&P500 are likely to be much higher.
The views and opinions expressed in this article are those of the author(s) and do not reflect those of Goldmoney or Menē, unless expressly stated. Please note that neither Goldmoney, Menē, nor any of its representatives provide financial, legal, tax, investment, or other advice. Such advice should be sought from an independent regulated person or body who is suitably qualified to do so. Any information provided in this article is provided solely as general market commentary and does not constitute advice. Neither Goldmoney nor Menē will accept liability for any loss or damage, which may arise directly or indirectly from your use of or reliance on such information. Goldmoney is a shareholder of Menē, the author a director and shareholder of Goldmoney, and has, therefore, an indirect interest in Menē.
This is a two-part report in which we analyze the dichotomy between current equity prices – which by conventional valuation metrics look extremely overvalued - and gold. In the first part of this report (see The equity-gold price conundrum – Part I, March 08, 2021), we identified the two common arguments put forward by the equity bulls why these valuations are justified:
1. The great Gatsby: The pandemic, as negative as it was for economic activity near term, will be followed by a period of unprecedented economic expansion. Hence, the GDP will rapidly rise and close the gap to equity prices.
2. The great inflation: Stock simply price in future inflation that eventually will come on the back of decades of ultra-low rates and central bank balance sheet expansion
We then took a closer look at the first argument: Proponents of the great Gatsby scenario argue that, once the COVID19 pandemic is behind us, as enough people are vaccinated and normality returns, economic activity will explode. However, we found that in order to close the gap between GDP and equity prices, the US would have to undergo a prolonged period of very high real economic expansion. Given the extent of this expansionary period, there is only one precedent since the end of WWII, and when that started, the US economy was in a significantly better starting position. Therefore, for the great Gatsby scenario to play out, substantial monetary and economic stimulus (infrastructure programs and potentially UBI) would be necessary[1]. However, these programs would have to be entirely debt financed.
Thus, the equity-gold conundrum doesn’t disappear in the great Gatsby scenario. In fact, we think that if we see strong economic growth over the coming years, it will entirely be debt-financed and, as a consequence, gold should outperform stocks, not the other way around
Exhibit 1: The equities-to-gold price ratio has increased amidst the global COVID pandemic
S&P500 $ / Gold $/ozt
Source: Goldmoney research
In this second part of the report, we look at the other possible justification for current stock prices – the great inflation scenario – and explore the viability of stocks outperforming gold in such an environment.
Scenario 2. The great Inflation
The great inflation scenario assumes that current equity valuations simply price in strong future inflation. In an inflationary environment, a company’s costs and revenues in nominal terms increase. All else equal, profits and thus stock prices should increase in line with inflation. The same happens to GDP. As equity markets are to some extent forward looking, equity prices are anticipating the inflationary impact on stocks before it happens in the real economy. Hence, if the market expects strong forward inflations, stock prices could temporarily detach from the current economic reality and equity valuation metrics such as total market cap to GDP begin to look very inflated. However, once inflation kicks in, nominal GDP increases, bringing stock prices, earnings and GDP back in line.This scenario seems intuitive at first sight. As we have highlighted before, prior to the outbreak of the COVID pandemic, the US economy, and by proxy the world economy, began to stutter and heavy intervention from the FED was needed to get the repo market under control. The Fed had slashed rates from 2.5% in July 2019 to 1.75% by December, before COVID19 ever hit the news. 10-year treasury rates dropped from over 3% to 1.5% over the same period (see exhibit 2).
Exhibit 2: The US economy started to look frothy by mid-2019, forcing the Fed to reverse course %
Source: FRED, Goldmoney Research
Back then, we concluded that the hike cycle had ended and that we would probably soon see new lows in real-interest rate expectations and a new high in the Feds balance sheet. What followed was truly unprecedented. The global COVID19 pandemic and the ensuing lockdowns sent asset prices spiraling and economic output contracted at its fastest pace in history. The Fed did not hesitate and slashed rates to zero. More importantly, it aggressively increased its balance sheet.
From the end of February to the end of May 2020, the Fed added $3tn in assets to its balance sheet. Other central banks followed. The ECB for example added EUR2.4tn to its balance sheet since March 2020.
Exhibit 3: Both the Fed and the ECB sharply increased their QE
$ mn Fed, EUR mn ECB
Source: Bloomberg, Goldmoney research
This pushed real-interest rate expectations sharply lower, with 10-years TIPs yields falling below -1% for the first time. While inflation expectations took an initial hit when the pandemic unfolded, dropping to almost 0.5% (10y breakeven), they soon climbed back and are currently at 2.2% (see exhibit 3).
Exhibit 3: Breakeven inflation expectations initially dropped sharply but are now back to over 2%
% 10-year TIPS yields
Source: FRED, Goldmoney research
One of the main differences between the great Gatsby scenario and the great inflation scenario is time. Real economic growth in one year is limited, but nominal growth due to inflation is not. In the first part of this report, we asked:
Even with a staggering 5% annual GDP growth and 2% inflation, it would still take more than seven years to get there. Are stocks really pricing in the year 2028 with 0% discount rate?
As we have demonstrated, there has hardly been any prolonged period with real growth at over 5%. However, in the 1970s, there were several years in the US with double-digit nominal GDP growth due to high inflation. Outside the US, there are plenty of examples where nominal GDP grew much faster than 5% as the currency rapidly devalued. Thus, in our view the great inflation scenario is better suited to explain current equity prices than the great Gatsby scenario. But does it solve the equity-gold price conundrum? In other words, should equities outperform gold on the cusp of a major inflationary period?
First of all, it’s important to get an idea on how much inflation would be needed to bring current equity prices back in line with historical valuations. One way to estimate this is to look at what level of nominal GDP is needed to bring total market cap to GDP back to reasonable levels. As a reminder, in part one of this report, we showed that total market cap to GDP stands at a staggering 193%. Historically, the average “sustainable” total market cap to GDP was around 100% (it was 120% over the past 10 years).
Arguably, current GDP is heavily impacted by the lockdowns. So for the sake of the argument, let’s assume that the US nominal GDP returns back to pre-covid levels once the economy reopens[2]. In that case, the US GDP would start at $21.4tn. Hence, nominal GDP would have to increase by 86% to bring the total market cap to GDP ratio back to 100% ($40tn), or by 63% to bring it to 120% ($35tn). Let us also assume that the US economy grows by 2% in real terms over the long run once it has returned to pre-covid levels. Over a period of 5 years, that would bring the nominal GDP to just $23.6tn. That means, it is up for inflation to fill the gap. Thus, inflation would have to be averaging at 10% to bring equity prices in line with GDP in 5 years. And that would require equity prices to stay flat for the next 5 years. Are equity markets that forward-looking? How much inflation is needed to get stock prices back in line over a shorter period of time? The table below gives an answer.
Table 1: Inflation needed to bring equities back in line with US GDP
$tnSource: Goldmoney research
As a result, in order for equity valuation to make sense even over the long run, VERY high inflation has to occur. However, when we look back at previous episodes of high inflation, we find that equities did not protect investors from inflation that well. After President Nixon temporarily suspended the convertibility of the USD to gold in 1971, de facto ending the gold standard, the US entered a prolonged period of very high inflation that only ended in the early 1980s. Corporate revenues rose with inflation, but stock prices lagged. In fact, it took stock prices 17 years to catch up with inflation (see Exhibit 2)
Exhibit 2: While corporate earnings rose with inflation in the 1970s, stock prices lagged
Source: FRED Goldmoney ResearchThus, investing in stocks has historically not been a great way to protect against very high forward inflation. Gold on the other hand is leading inflation. As for the equities to gold ratio in high inflationary periods, It took the S&P500 27 years from 1971 to pick up with gold (see exhibit 4)
Exhibit 4: Gold was pricing in future inflation much more efficiently than stocks during the 1970s
Source: Bloomberg, Goldmoney ResearchArguably, stocks also pay dividends, so it would be unfair to just compare prices. But even when we take dividends into account, the SP500 massively underperformed gold both in the run up to and during the double digit inflation year (see exhibit 5).[3] When inflation peaked in the early 1980s, gold had outperformed dividend reinvested stocks by a staggering 1500%. It would take equities with reinvested dividends a full 14 years to fully catch up with gold, despite gold prices declining sharply form their peaks as Fed chairman Volker aggressively raised rates to over 20% to combat inflation.
Exhibit 5: Even with reinvested dividends, equities massively underperformed gold in the 1970s inflation
Arguably, even though inflation and inflation expectations picked up recently, until now we actually have not seen the unprecedented monetary policy of the past 12 months to translate into an equal move in consumer price inflation. Instead, it led almost exclusively to asset price inflation. This is very different from the 1970s, which saw staggering price inflation in all goods and services. Should gold still outperform stocks in such a scenario? We do have a historical example of a monetary environment that primarily led to asset price inflation with relatively benign consumer price inflation as measured by the CPI. That is the period of extreme monetary policy since the great financial crisis. The Fed began cutting the its funds rate in September 2007 as the subprime mortgage crisis unfolded. From September 2008 onwards, it was aggressively expanding its balance sheet. By December 2008, it had slashed rates to zero.
We find that gold outperformed stocks from any of these starting points for at least 4 years (see Exhibit 5). In fact, when measured from the first time the Fed cut rates in 2007, gold outperformed stocks for 11 years.
Exhibit 5: Gold outperformed stocks (S&P500) in an environment where inflation was primarily occurring in asset prices
Source: Goldmoney ResearchTo summarize:
1. We find the great Gatsby scenario of an explosion in real economic growth over the coming years implausible, unless it is on the back of huge infrastructure spending, entirely financed through an unprecedented expansion in debt. However, such a debt expansion would favor gold over stocks.
2. We find the great inflation scenario is plausible, but in this scenario too, we expect gold to outperform stocks
3. Should neither scenario occur, then stocks are due for a significant correction. This would ultimately again force the Fed to intervene, which would also favor gold (however, the initial correction in equities may also negatively affect gold prices, but much less so, and only for a brief period).Thus, in our view, while timing remains challenging, we expect gold to outperform stocks over the next few years.
[1] Whether that would be sufficient is a different question
[2] As we have outlined before, there is plenty of reason to argue why this will probably not be the case.
[3] We assumed that dividends are taxed at the current 22% and applied minimal costs for brokerage fees and potentially management fees of 25bps per year. True costs to maintain a portfolio closely mimicking the S&P500 are likely to be much higher.
The views and opinions expressed in this article are those of the author(s) and do not reflect those of Goldmoney or Menē, unless expressly stated. Please note that neither Goldmoney, Menē, nor any of its representatives provide financial, legal, tax, investment, or other advice. Such advice should be sought from an independent regulated person or body who is suitably qualified to do so. Any information provided in this article is provided solely as general market commentary and does not constitute advice. Neither Goldmoney nor Menē will accept liability for any loss or damage, which may arise directly or indirectly from your use of or reliance on such information. Goldmoney is a shareholder of Menē, the author a director and shareholder of Goldmoney, and has, therefore, an indirect interest in Menē.