Summer doldrums
Jun 9, 2023·Alasdair Macleod
Gold and silver prices rose from last Friday, defying the naysayers. In European trade this morning, gold was 1962, up $13 on the week, while silver outperformed gold at $24.30, up 75 cents. As our headline chart shows, silver appears to be leading the way higher.
Silver is the narrower and more volatile market and can therefore be indicative of underlying market factors. There is little doubt that the silver bears are being squeezed. The Swaps on Comex are trying to contain their short positions, presumably in the knowledge that underlying demand for physical metal is draining paper liquidity. In silver’s case, Comex appears to be increasingly bypassed leaving the contract as an illiquid backwater.
So far this year, 12,996 silver contracts have been stood for delivery, representing nearly 65 million ounces (over 2,000 tonnes). As an industrial metal, demand is strong due to demand for solar panels and other critical energy and electronic applications. Manufacturers are bypassing markets, dealing directly with refiners, and refiners are also dealing directly with mines and intermediaries such as Glencor. In that context, to lose an annualised 4,000—5,000 tonnes through deliveries out of the market becomes a real problem for the bullion bank traders who make up the majority of Comex Swaps.
Nearly 240 tonnes of gold have been delivered out of Comex since 1 January, which is less of an issue because of the higher trading liquidity. Nonetheless, the Comex gold contract was not intended by its users to be a delivery market, and with 55 tonnes delivered in the last seven trading sessions, it is clear that deliveries are a rising tendency.
This trend for physical stock to leach out of paper markets is reflected in the gold/silver ratio, which appears to be in a declining trend.

A chart-watcher would say that the ratio has some work to do between 75 and 80, but after that it could be in freefall.
Returning to gold, macro traders are less positive. They see an ugly combination of high interest rates, quantitative tightening, and a recession. They claim that high interest rates are bad for gold, and a recession will continue to drive down commodity prices making gold look expensive. But the single most important flaw in their argument is to assume a constant purchasing power for dollars in the pricing of commodities, including gold.
When you examine commodity prices they have softened materially over the last year, particularly for natural gas and WTI oil. Base metals have also declined, with copper down 13%. By way of contrast, gold and silver are up 6.7% and 12.4% respectively. Adding to commodity woes is a disappointing performance by China’s economy.
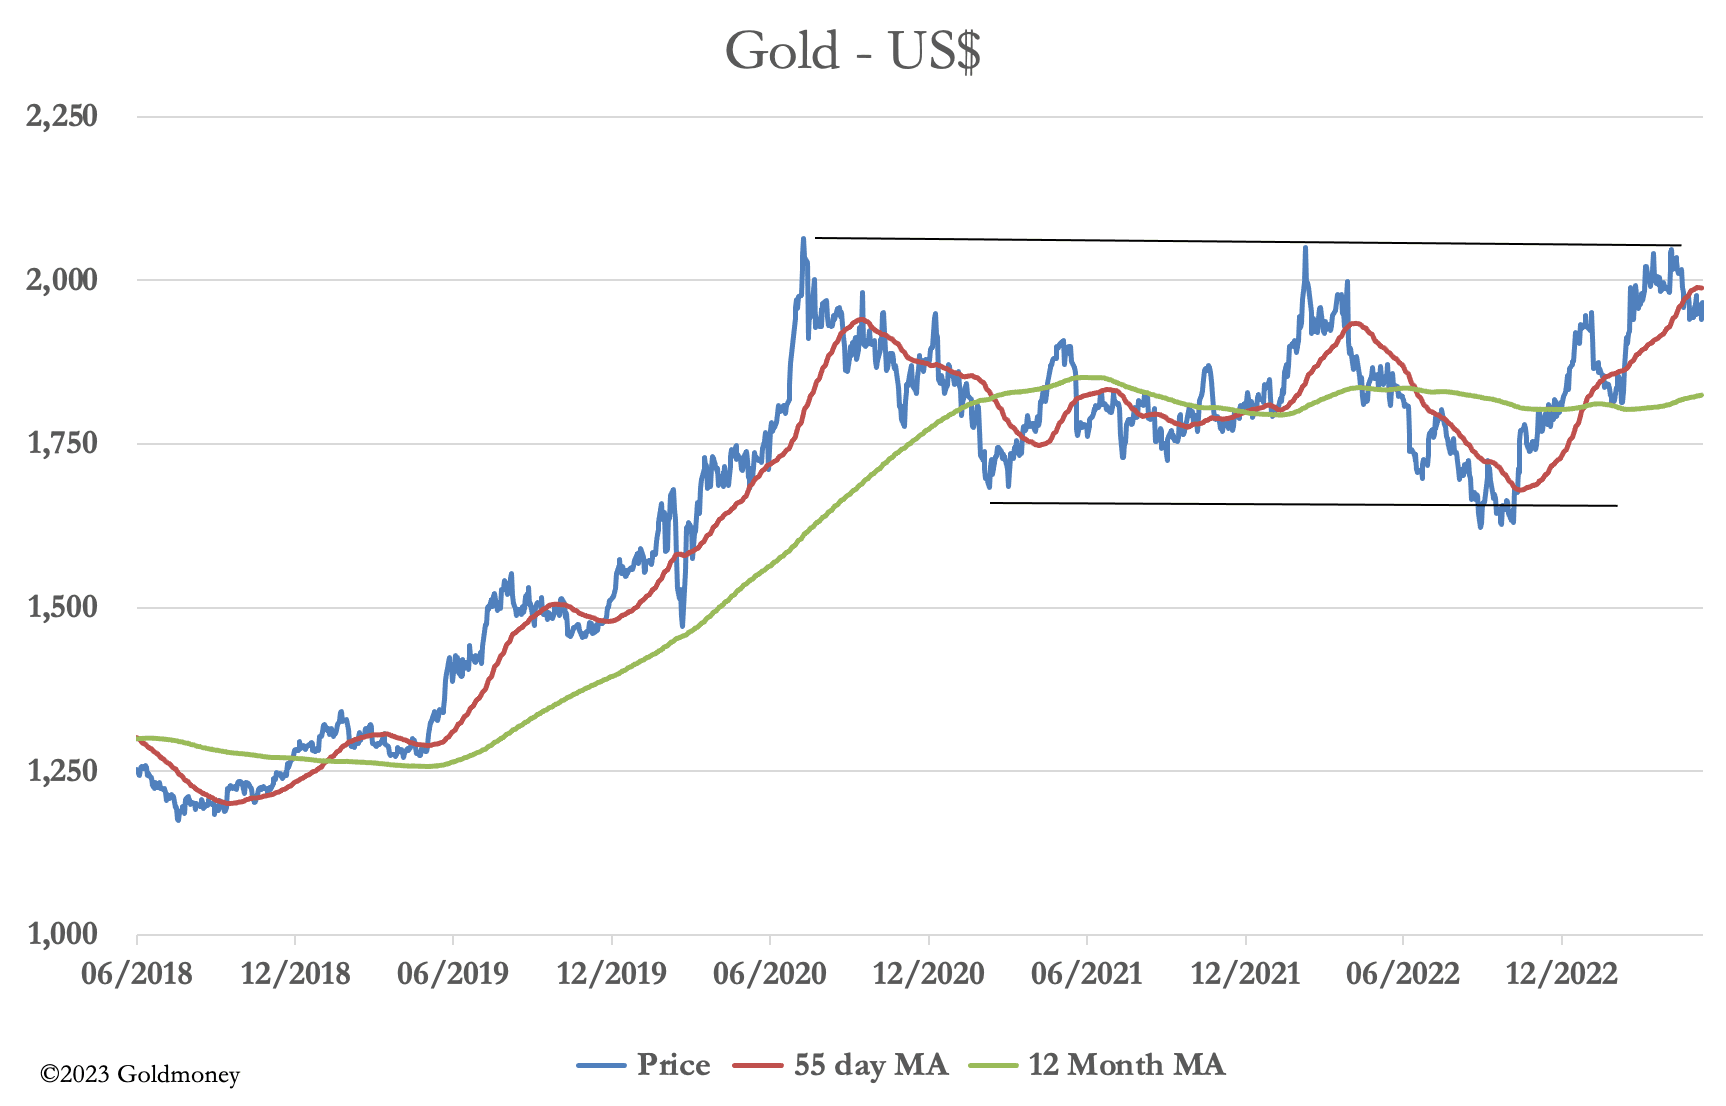
But the point about summer doldrums is that all this is discounted, while the dangers to the fiat credit system are not — the latter because they are poorly understood, and humans tend to live in hope. Gold’s technical chart suggests this pullback is a healthy correction ahead of the next challenge to all-time highs.