Silver soars, gold follows
Sep 12, 2025·Alasdair MacleodBull markets in gold and silver, or more accurately the dollar’s disaster, resume as demand mounts ahead of the Fed’s FOMC meeting next week when a cut in rates is expected.
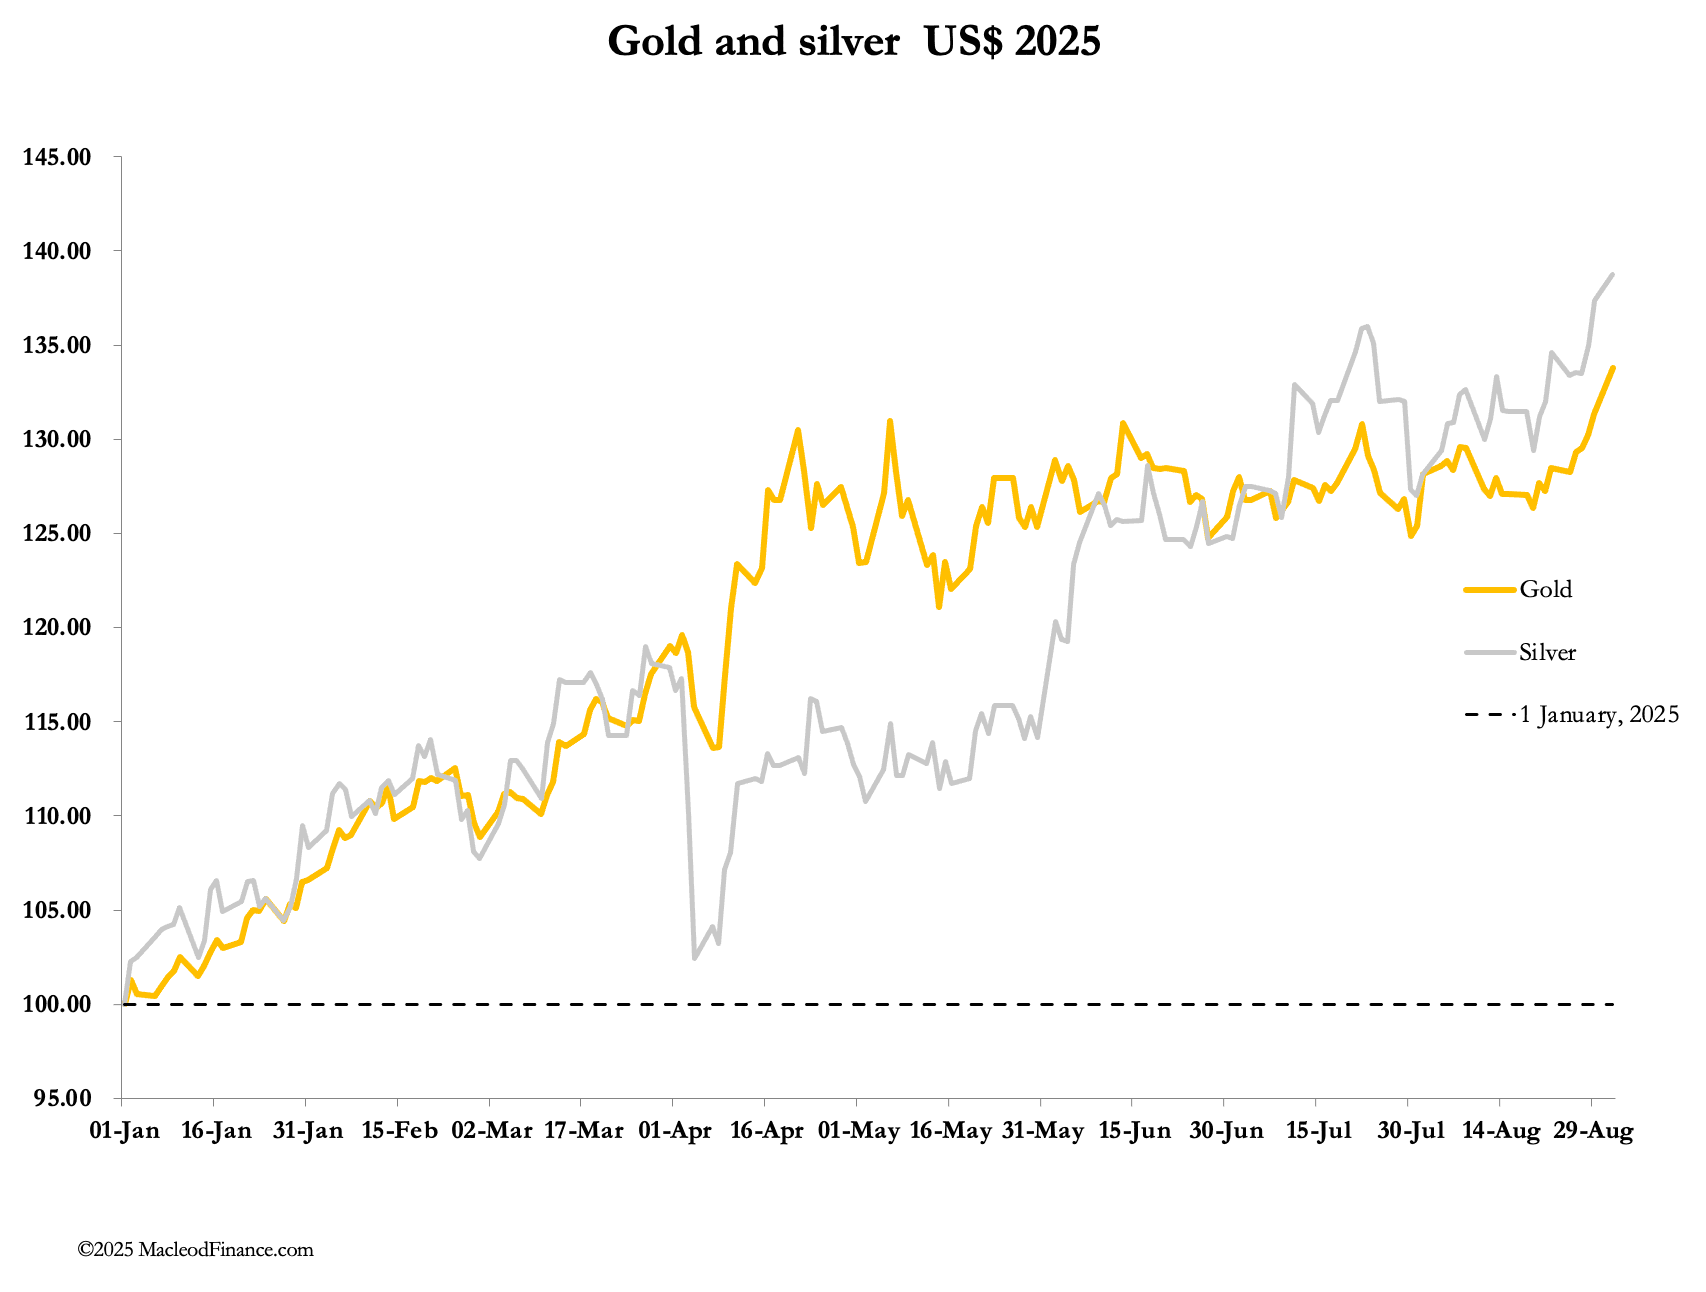
This morning, gold and silver ventured into new high ground after a week of minor consolidation. In early morning European trade, gold was $3650, up $64 from last Friday’s close and 39% since 1 January. Silver was $42.15, up $1.17, and 46% higher over the same respective timescales.
In their particulars, the factors driving gold and silver differ. In gold’s case, speculator demand is beginning to build, evidenced in open interest (the black line) in the chart of the Comex contract below:
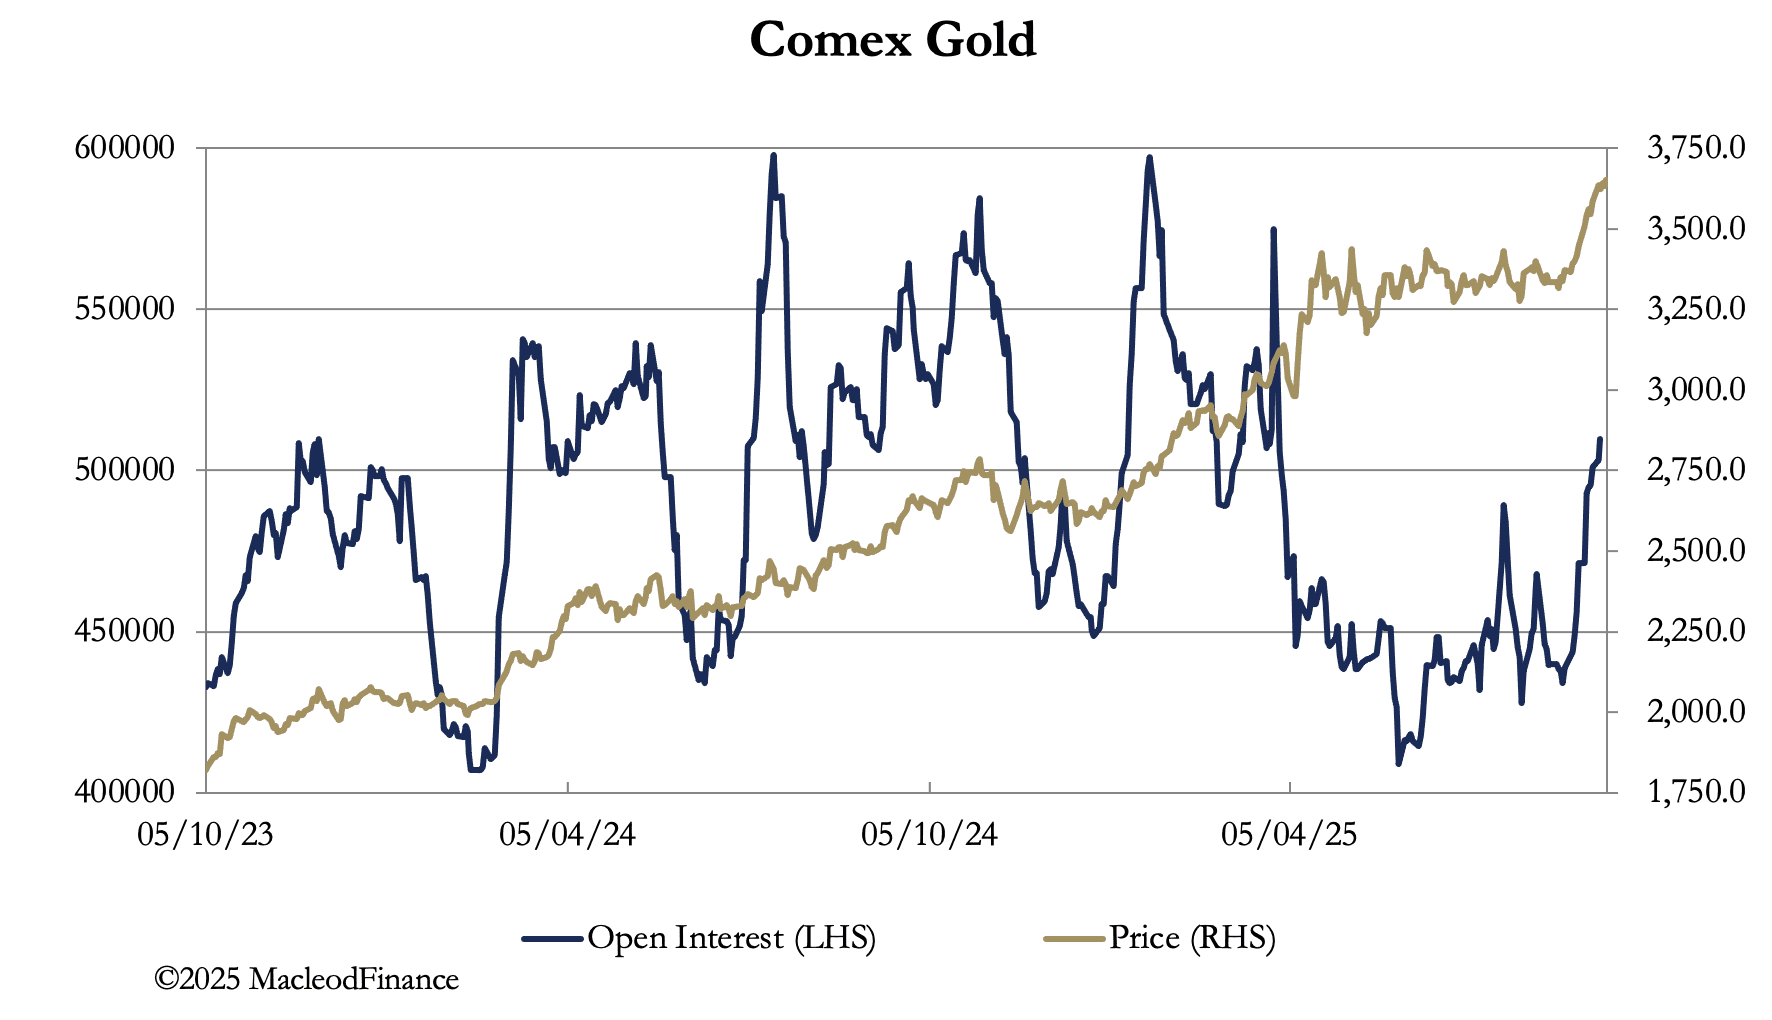
This chart is instructive: since March, open interest began to fall sharply while the price continued to rise peaking at $3445 in early-April, since when the price consolidated sideways, despite speculator liquidation taking open interest to its lowest level since February 2024. After a period of normalisation based around 450,000 contracts, at the end of August speculators finally began to buy, driving the price above and out of its consolidation pattern into new high ground.
The normal relationship between buying and a rising price has been restored, with some way to go before this contract becomes technically overbought. Context is important, which I will address below after looking at silver.
Silver exhibits not so much speculator buying as a systemic bear squeeze, illustrated by this chart from Bloomberg (posted by Ronnie Stoeferle of Incrementum on X):
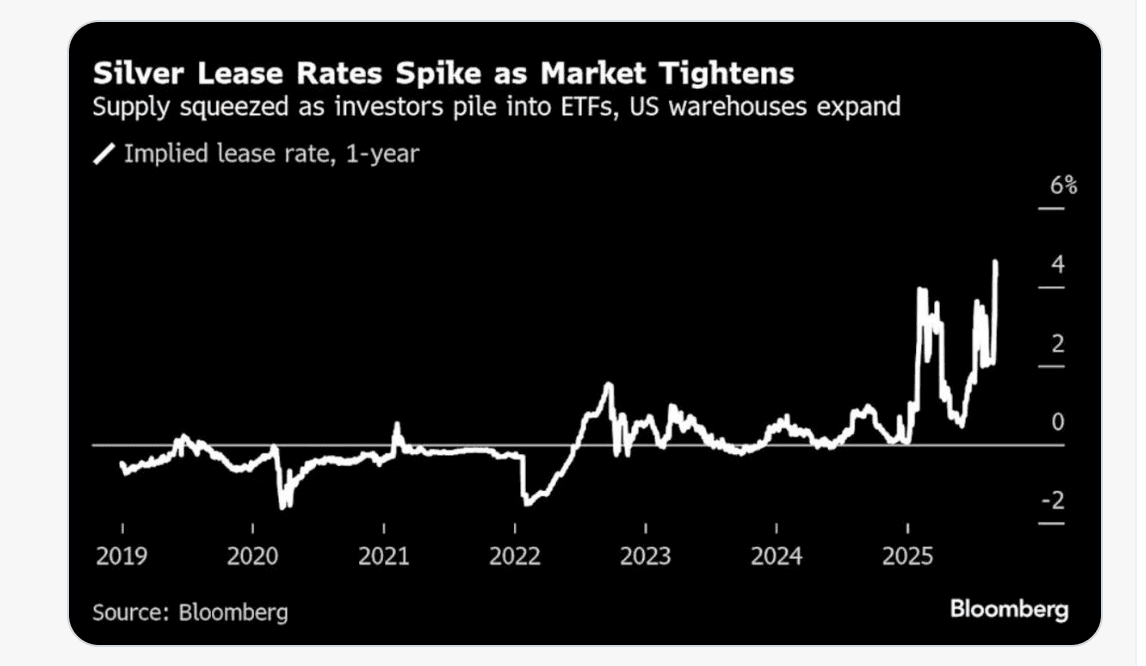
The spike in lease rates to the highest level for many years is the clearest evidence of a panic for physical silver. It sets the scene for the dynamics behind our next chart, of open interest on Comex and its relationship with the price:
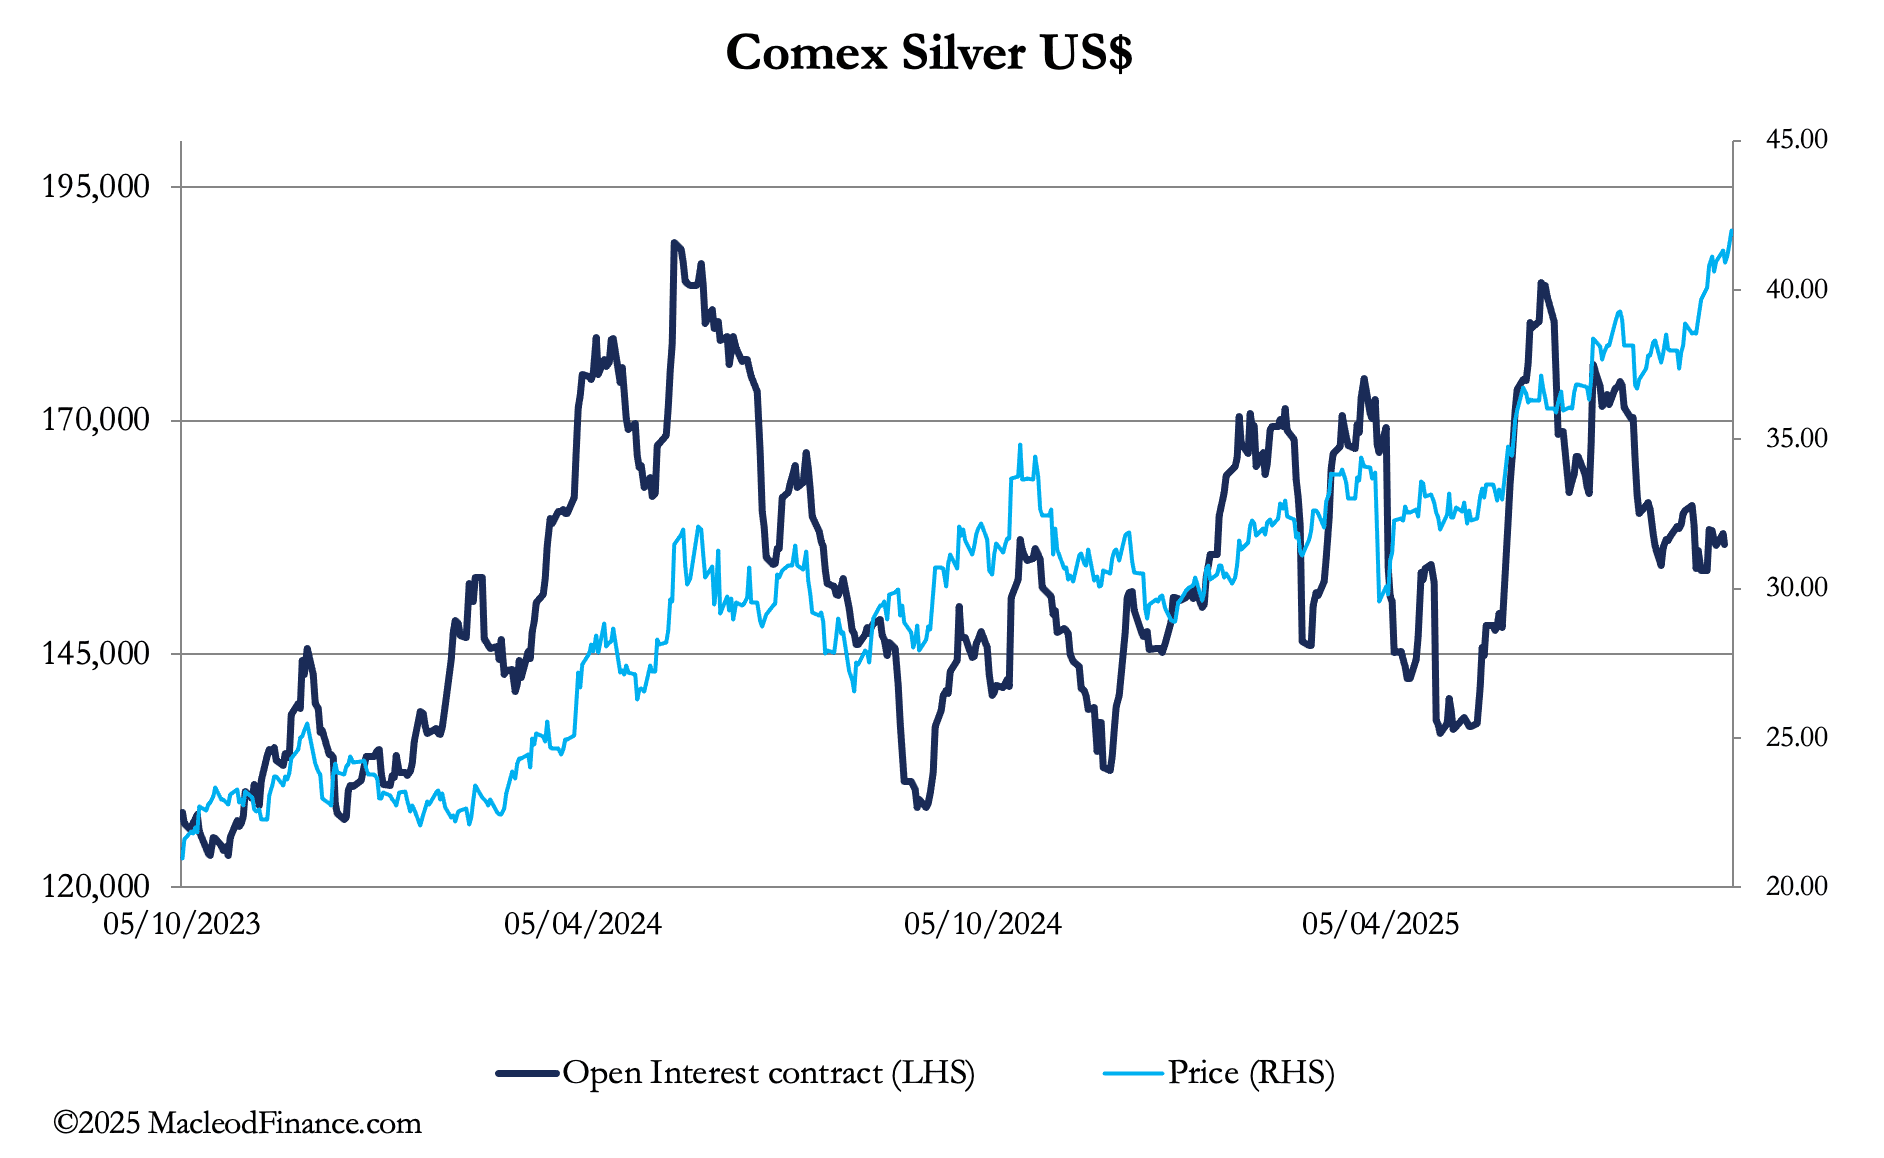
Open interest has declined while silver has soared, clear evidence of the price being driven by a systemic squeeze while speculators stand aside. Meanwhile, stand-for-deliveries are substantial, with 58,255,000 ounces (1,812 tonnes) since just 29 August for a total of 10,550 tonnes so far this year. This represents physical liquidity vanishing, so it’s little wonder that the systemic squeeze is on.
Shortly, we can expect speculators to spot this and chase silver prices higher still. Furthermore, growing public participation from those who feel that they have missed out in gold’s upward momentum are likely to view silver as the affordable alternative. This demand will almost certainly be through ETF buying against a background of diminishing physical liquidity with a disproportionate effect on the price. Therefore, a rerating to a gold/silver ratio below 50 and even lower still (currently 87 and falling) is not impossible.
Next week will see the Fed’s FOMC decide on a likely cut to the Feds funds rate, widely expected to be 0.25% with some going for 0.5%. This suggests that gold could see some short-term profit taking on a 0.25% cut, or would rise on 0.5% reduction. But in a more general context, it’s all about weakening the dollar. It’s trade weighted index appears due to slide significantly lower, which is our last chart:
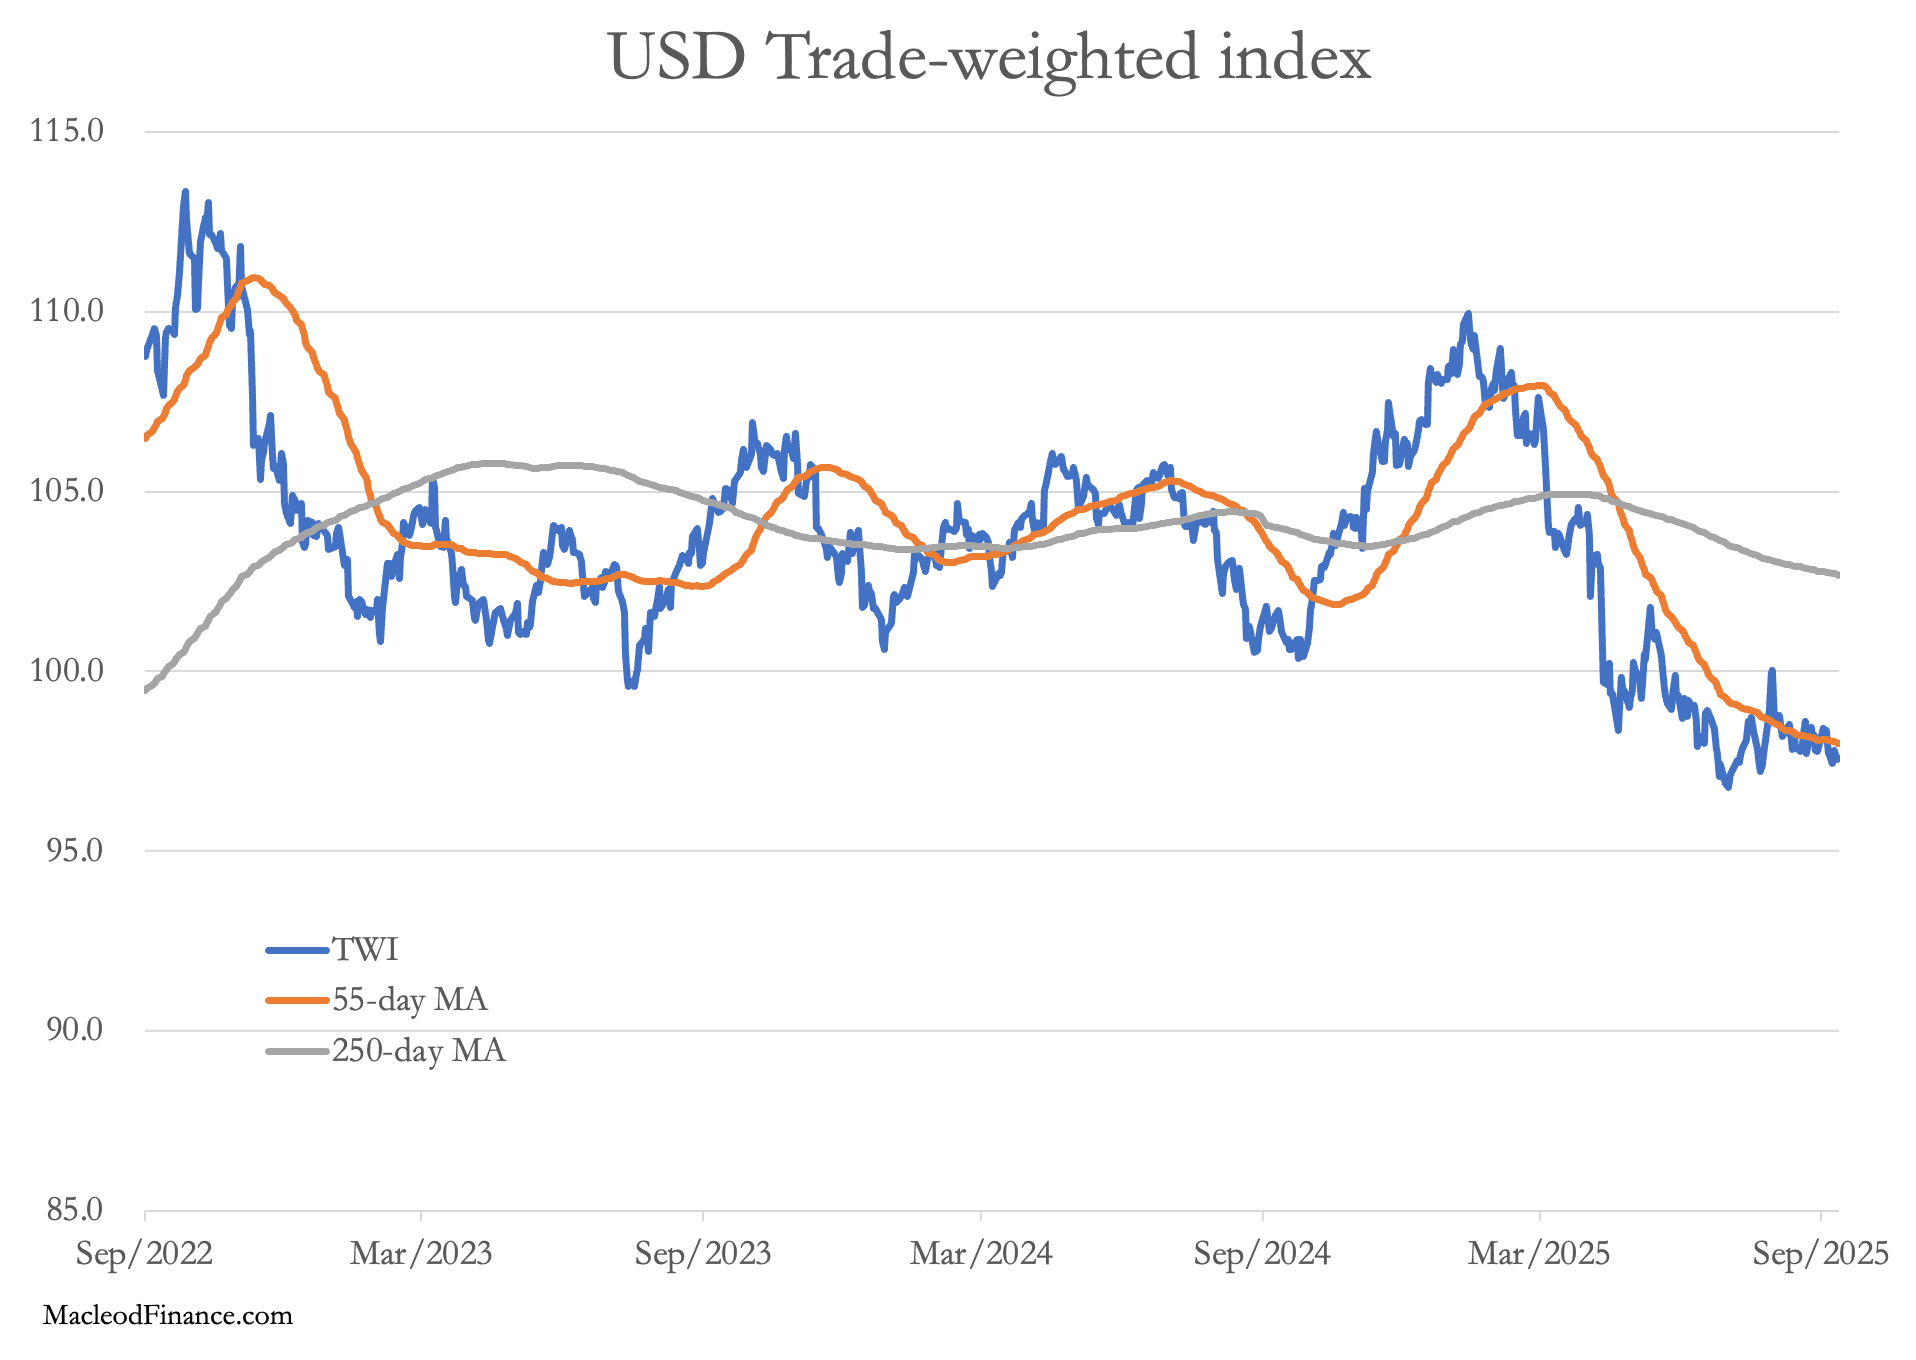
A lower dollar is the ambition of President Trump and Stephen Miran, his new FOMC rate-setting acolyte and author of the Mar-a-Largo accord. It is surprising that the foreign exchanges are yet to reflect the importance of these developments.
Of course, they will — probably suddenly. This likelihood is being front run by gold. But when the dollar’s TWI declines convincingly below its current 97.5, gold will almost certainly go far higher, reflecting declining dollars.
We finish with gold’s updated technical chart:
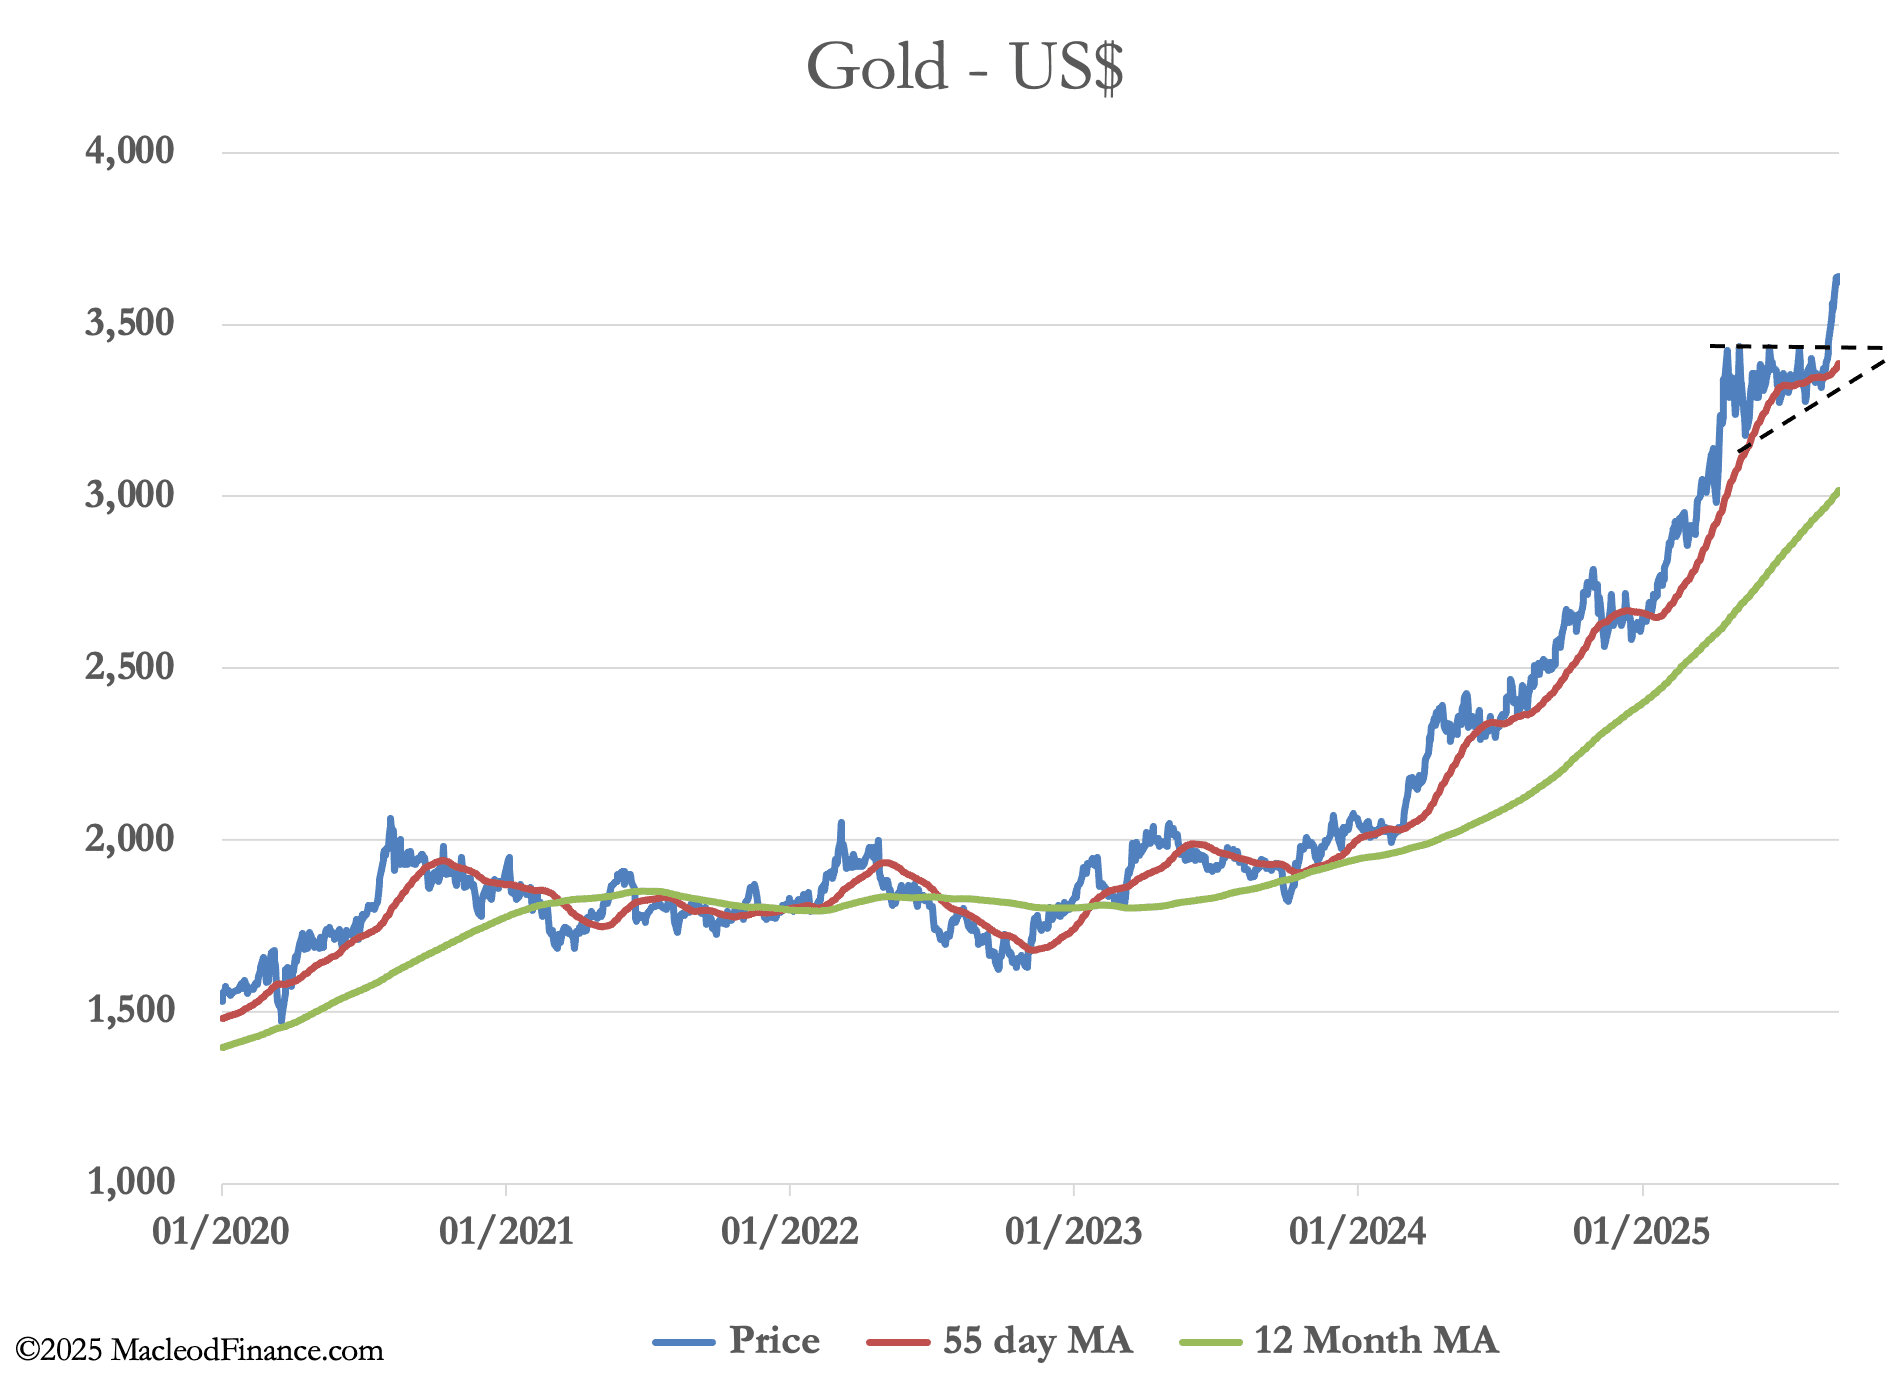
Strong gold, without doubt. But really, it’s the dollar’s disaster.