Silver leads the way higher
Jul 18, 2025·Alasdair MacleodSilver swaps are facing a short squeeze in poor liquidity, with lease rates on the September Comex contract at over 5%. Gold continues to consolidate in a bullish pennant formation.
This week, gold continued its consolidation, while silver squeezed higher from Wednesday onwards. In European trade this morning, gold was $3350, down a paltry $5 from last Friday’s close. Silver was $38.35, barely changed on balance.
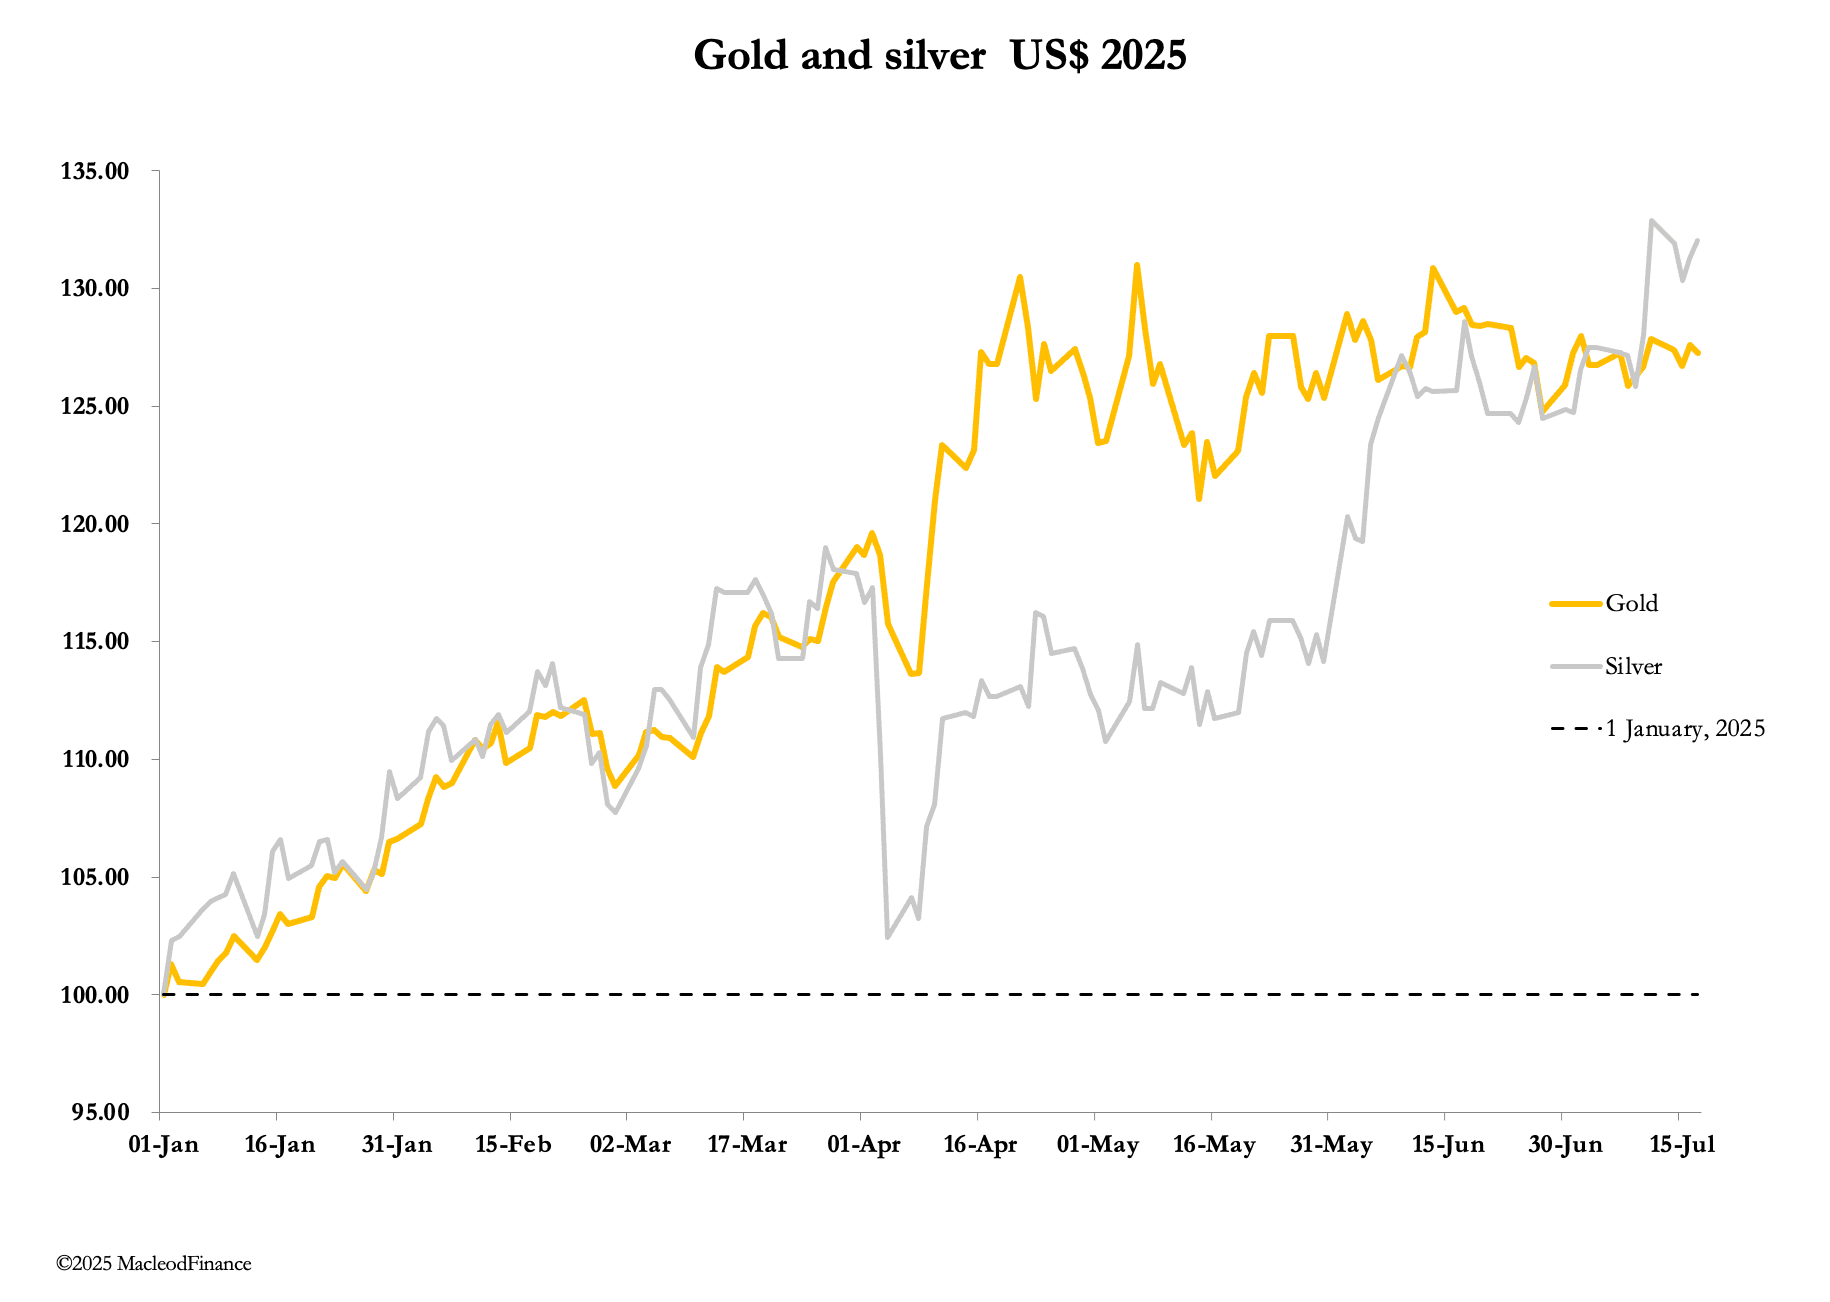
As our headline chart shows, silver is now outperforming gold, up 32% v gold up 27% this year so far. Will it continue?
I think the answer is yes. Silver has underperformed gold over the last decade, culminating in a gold/silver ratio of 121 in March 2021. That has come down substantially, but at 87 is still too high for a metal which is in growing supply deficit. Furthermore, future mine supply in the longer term is hampered by the lack of new discoveries for both silver and other metals where silver is a byproduct, and environmental and planning restrictions resulting in substantial lead times for new mine development.
The chart also remains positive:
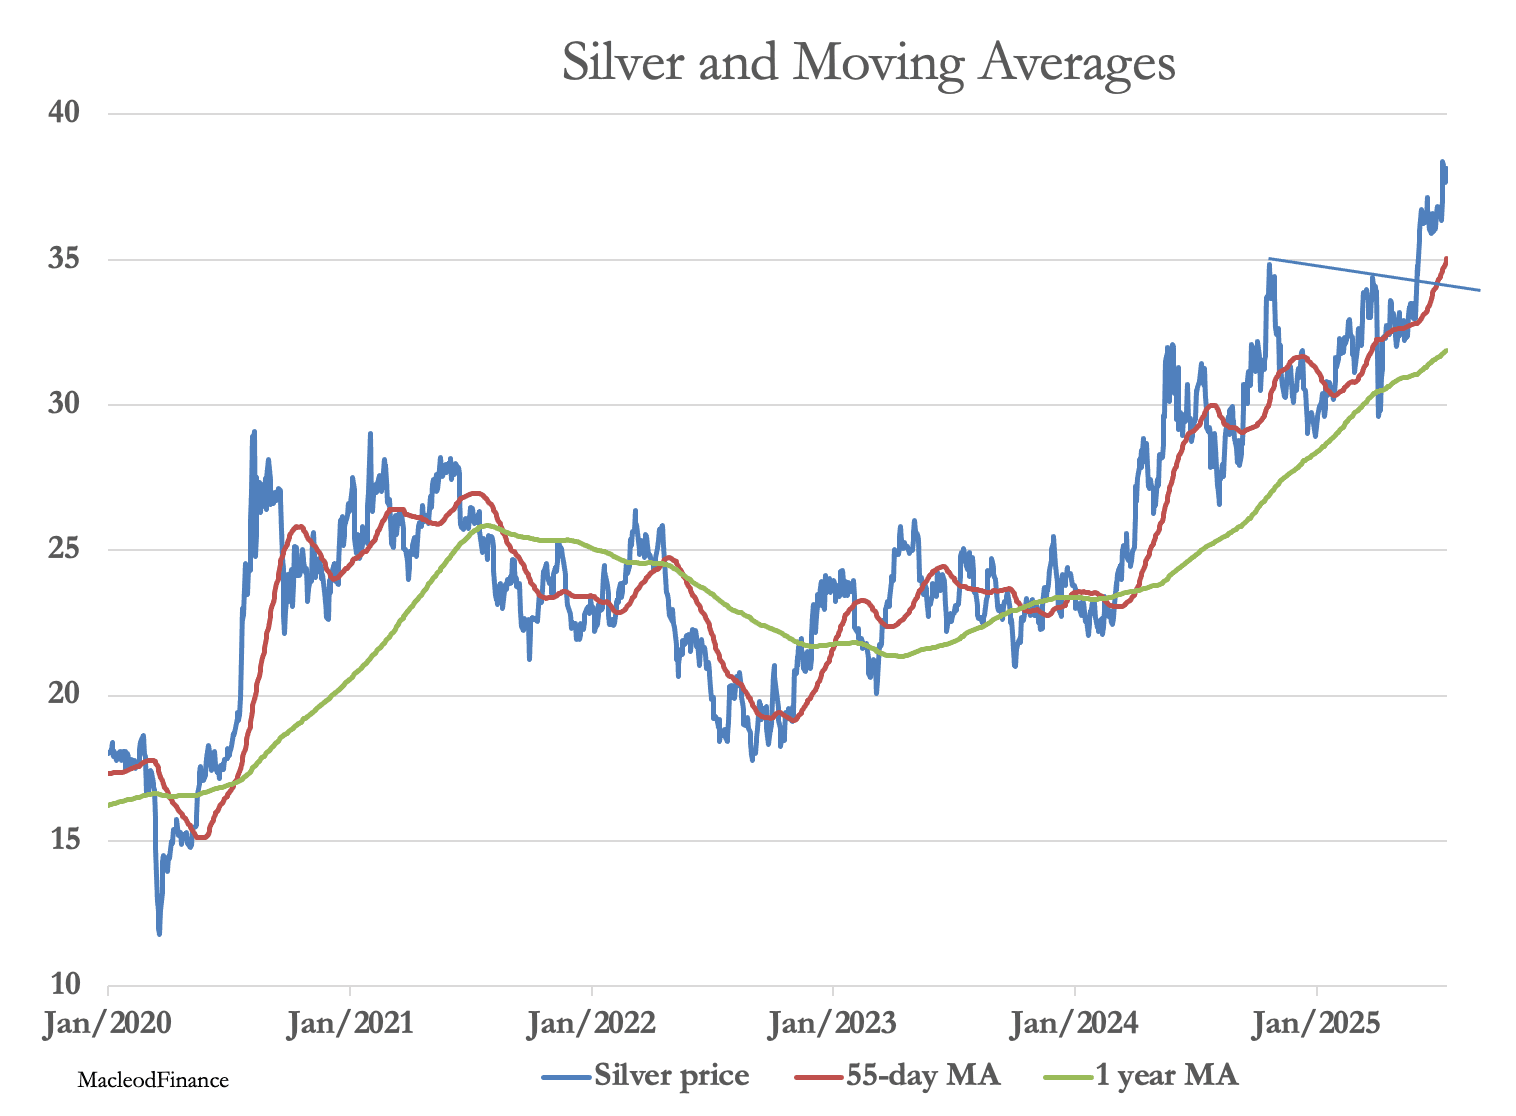
Silver appears to be in runaway mode, perhaps needing some consolidation in the $40 region. That would make sense, with the short side in paper markets is being badly squeezed, reflected in the relationship between Comex’s open interest and the price:
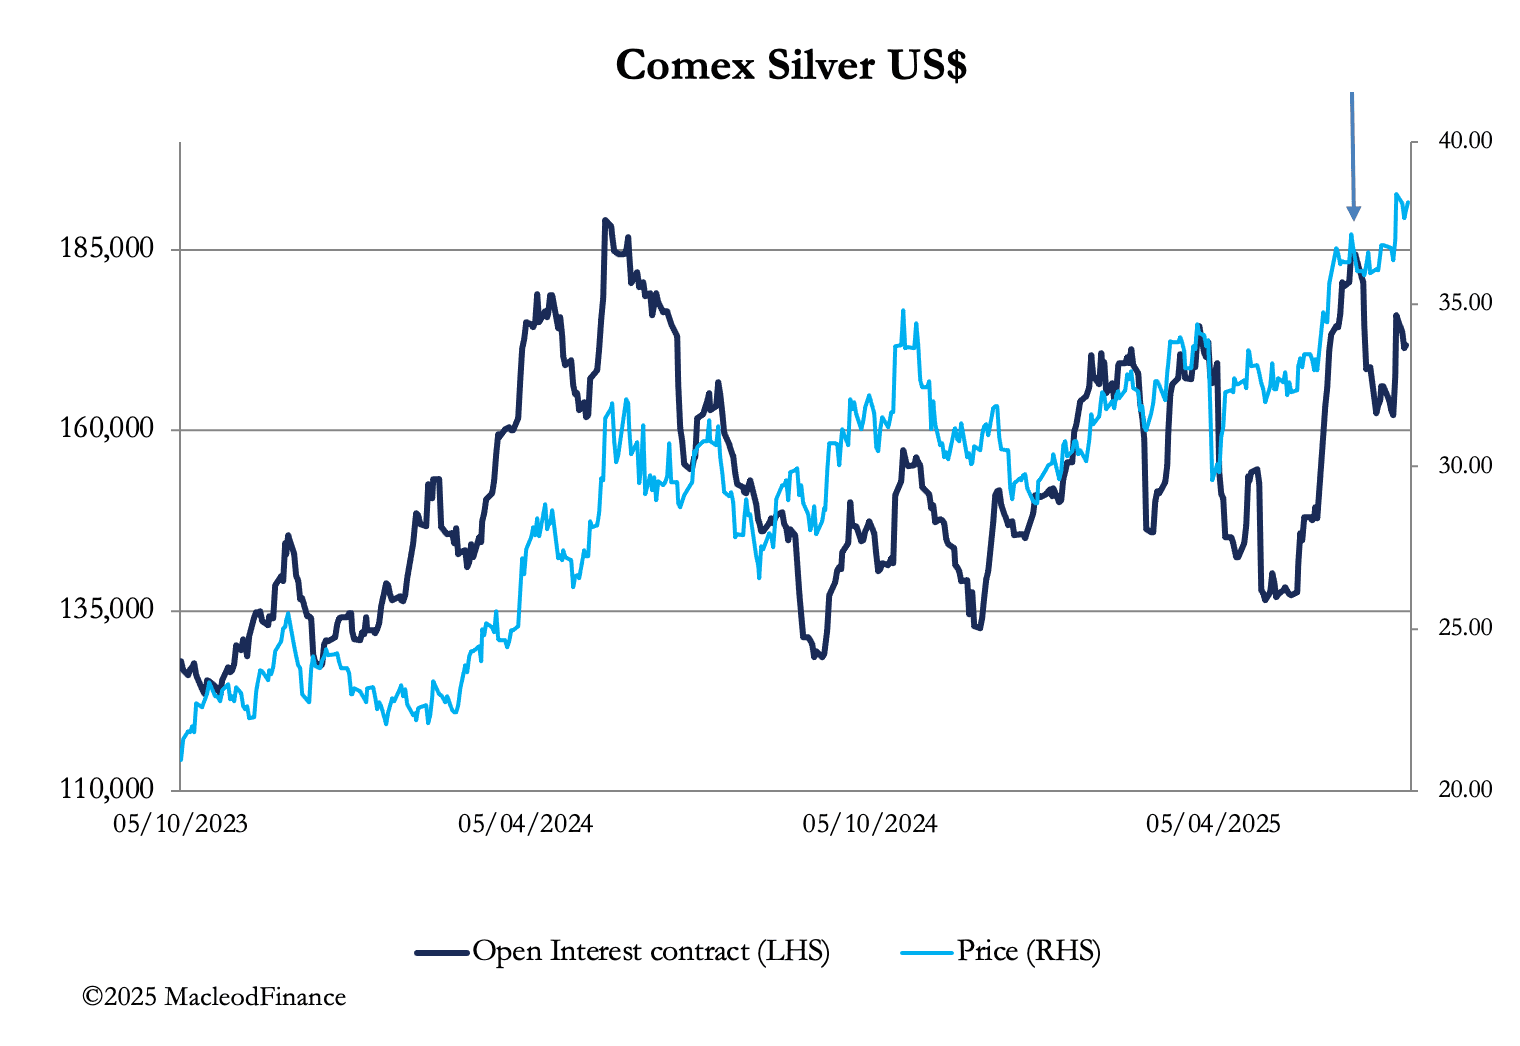
Note how the price continued rising after the decline in open interest following its peak on 17 June (arrowed). This is evidence of a vicious bear squeeze, whereby liquidation of long positions failed to result in lower prices. And now open interest is rising, piling further pressure on the shorts, particularly in the swap category.
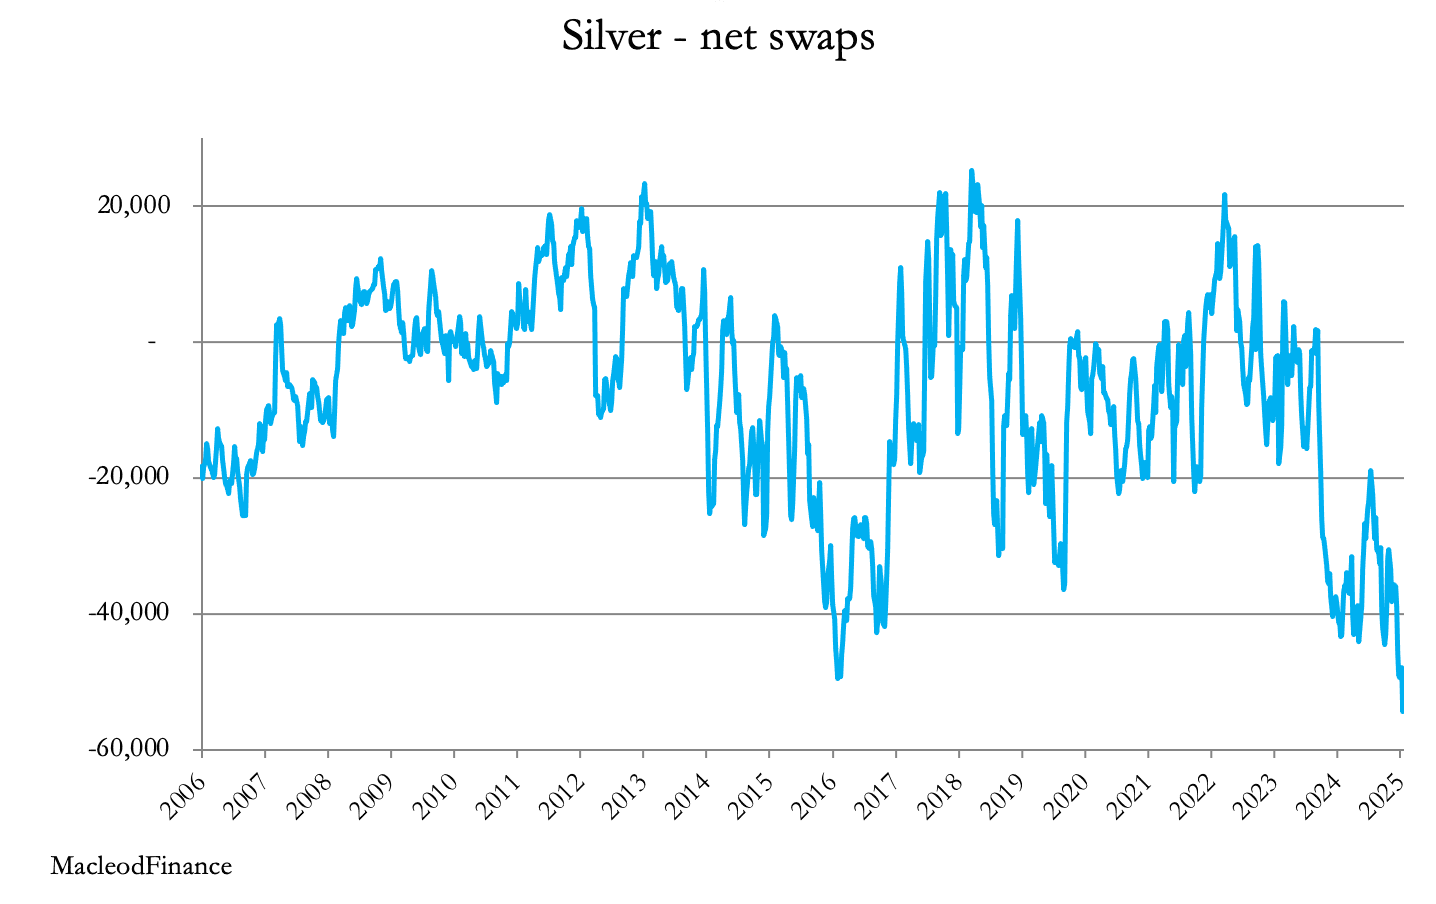
The record net short position is comprised of 27,804 long contracts as well as 80,128 shorts, the latter representing 400,640,000 ounces (update due tonight). The shorts are held by 24 traders, giving an average financial exposure of $634m per trader in illiquid conditions.
This is against a background of record Comex warehouse stocks as the MacroMicro chart shows:
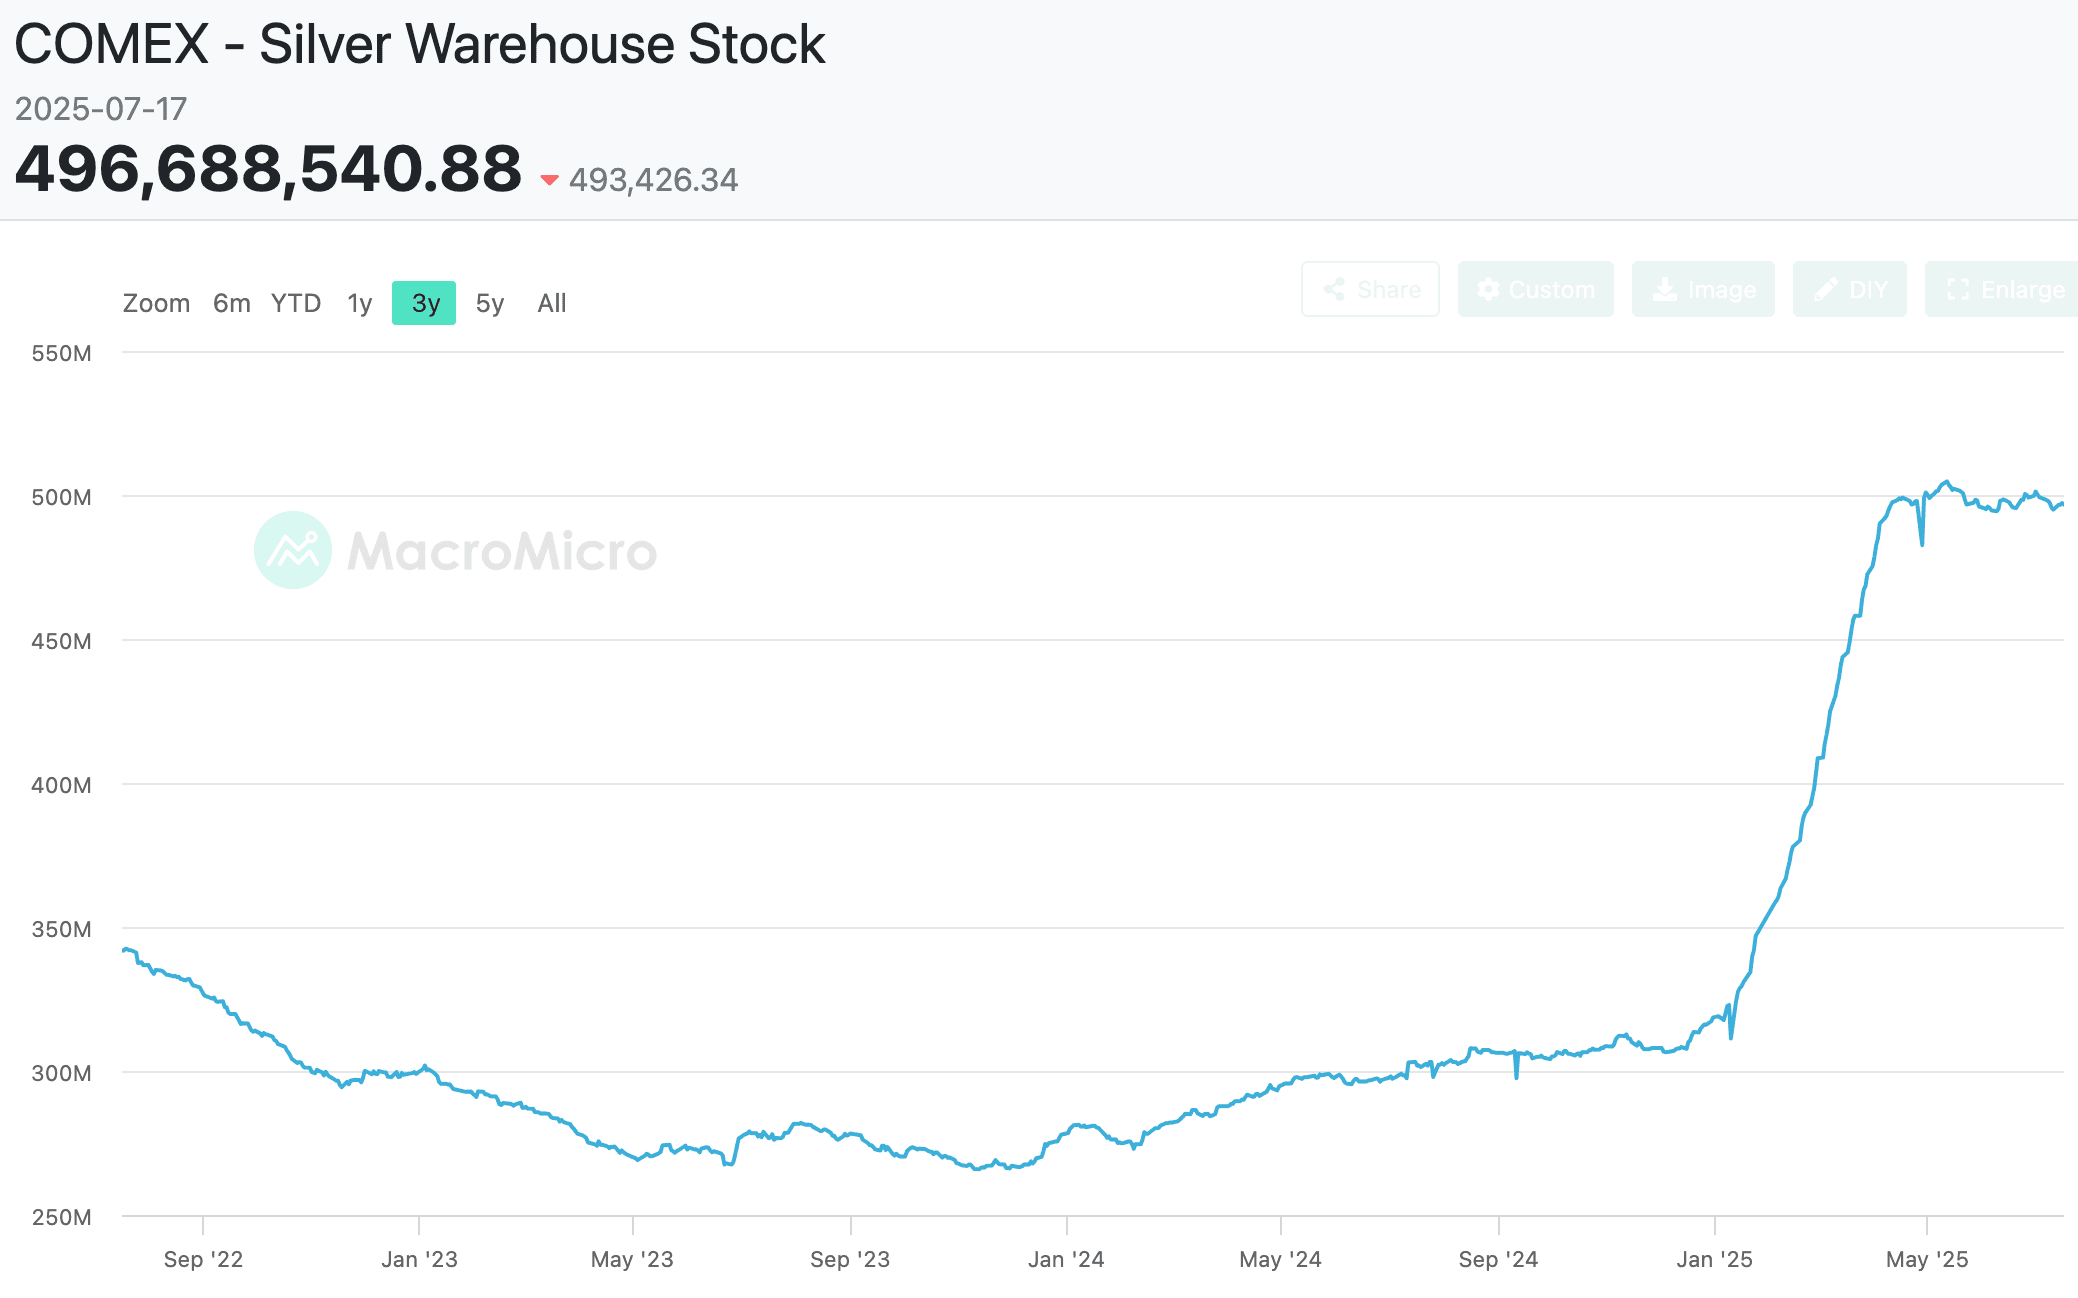
Comex warehouse stocks are the equivalent of 60% of mined supply. Commercial users appear to be treating Comex as the largest supply source of above-ground silver. In other words, silver is accumulating, with its new owners happy to store it in Comex vaults until they need it.
A factor driving the paper shortage is high lease rates, at over 5% today on the September contract confirming the liquidity shortage despite high warehouse stocks. The latter appears to incorporate a fear factor, reflecting Trump’s proposed blanket tariffs on Mexican imports, with the swaps being squeezed by poor liquidity.
In conclusion, it appears sensible to own physical silver in these conditions, because this squeeze looks like it has further to go, despite warehouse stock levels.
Silver’s potential is against a background for gold. Gold has been consolidating nicely in a bullish pennant formation which is now three months old.
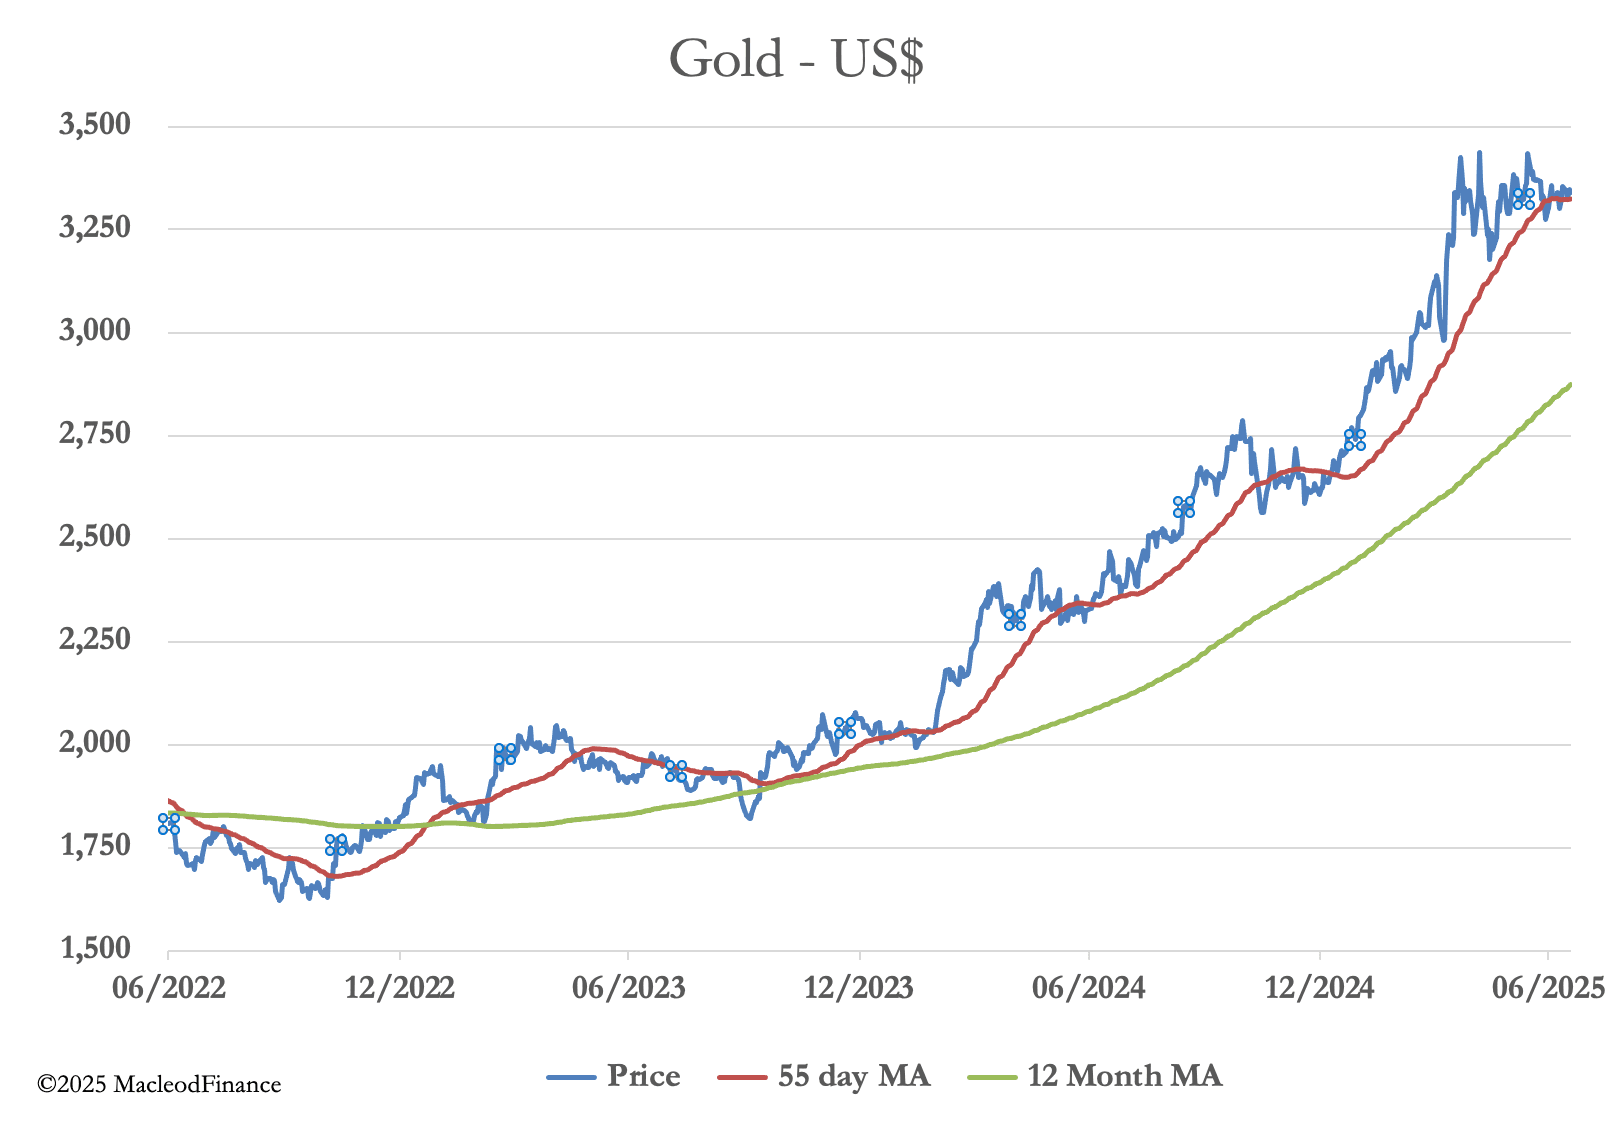
Probably the most important news in recent weeks is Trump’s frustration that the Fed won’t reduce interest rates. Sensibly, Powell is keeping his head down and not being dragged into commenting. He surely knows that inflationary pressures are mounting, in part due to Trump’s tariff policies. He also knows that the Fed has a funding problem with a lack of demand along the treasury yield curve to absorb new debt and the refunding of maturing debt. To reduce interest rates goes against the inflation mandate and would make debt funding more difficult, other than by escalating T-bill issuance.
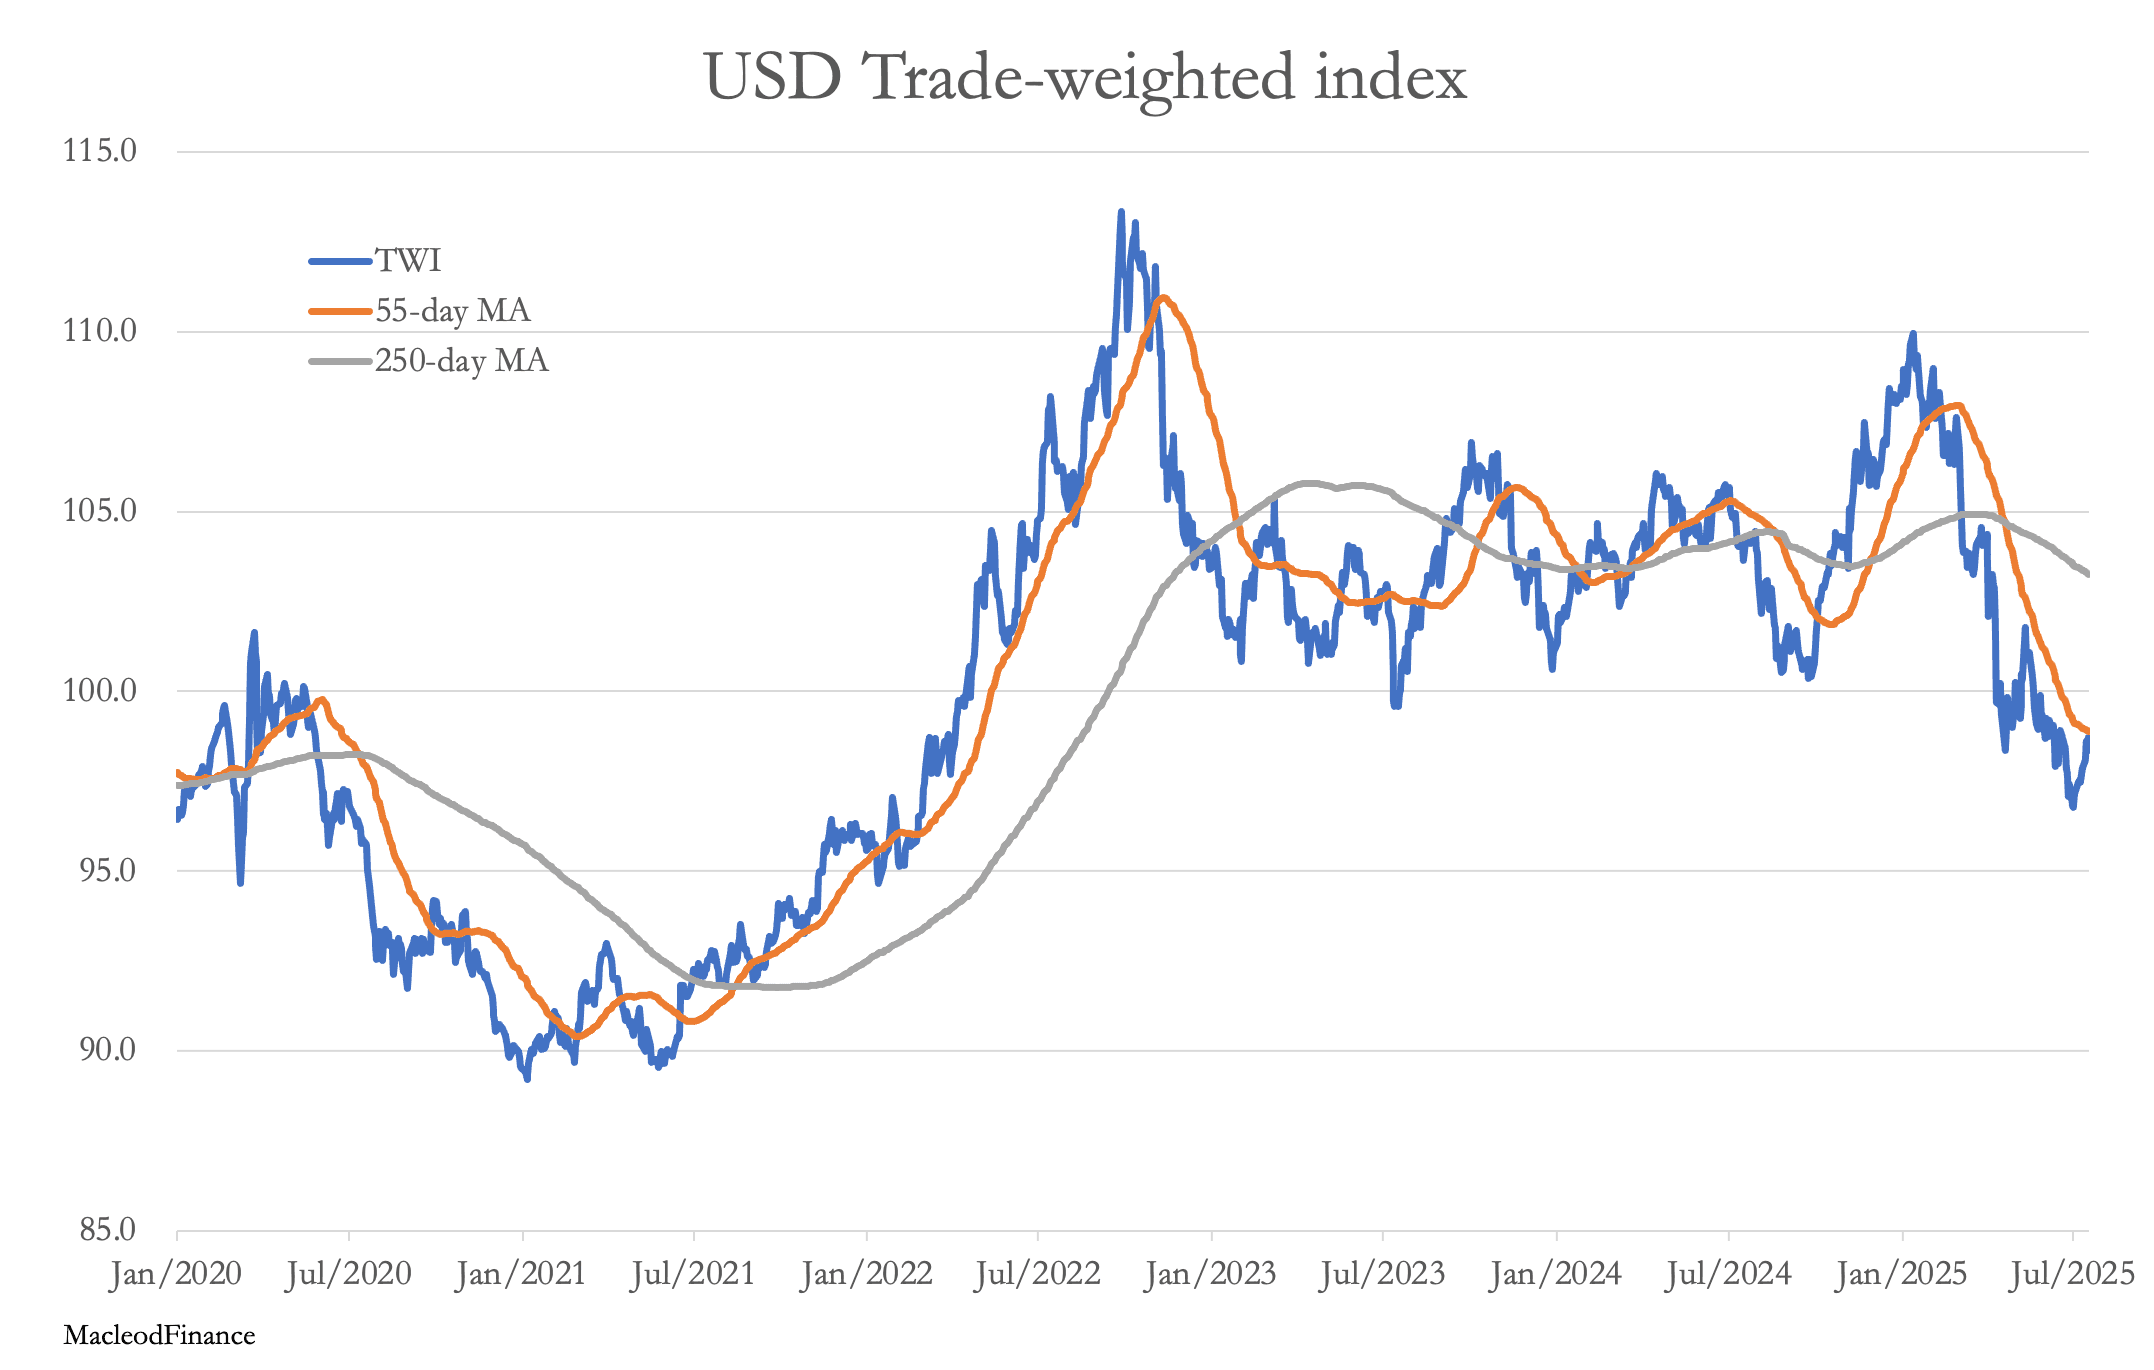
Meanwhile, the dollar’s trade-weighted index has stabilised — for the moment. But the chart says it is still going lower. The Powell/Trump issue could determine the timing of the next move.