Silver in a recession
Apr 13, 2023·Goldmoney StaffSilver prices have strengthened remarkably over the past few months. In the fall of 2022, the metal had dropped to around $18/ozt, the lowest since early 2020. Since then, silver has pushed higher and is now again hovering around $25/ozt. The recent strength in silver prices comes on the back of stronger gold prices. Gold once again is trading at over $2000/ozt, close to its all-time high.
A few years ago we introduced our silver price model to our readers (Silver price framework: Both money and a commodity, March 9, 2017). In that report we presented the following findings:
While market analysts, financial media, and commodity investors often regard silver as gold’s temperamental cousin, simply viewing silver as a more volatile version of gold fails to give the metal due consideration. Just as the physical properties of gold destined it to become an ideal store of value, silver’s properties make the metal special in its own right.
As explained in our Gold Price Framework, gold is not a flow commodity. Historical currency correlations and rate-driven volatility indicate that gold trades as a money stock; however, silver is special because it’s similarly well-suited to be money as well as an input commodity consumed in a variety of industrial processes.
Thus, silver prices are driven by monetary demand as well as supply and demand for industrial purposes, the latter of which is an important differentiator. Above ground gold stocks have always grown at the same pace as new gold is mined, dampening the effects of inventory-determined price volatility; however, silver stocks grew much more slowly as industrial demand absorbed a large part of what is mined.
1. Silver is, like gold, a commodity store of value and free of counterparty risk, with energy-intensive replacement costs setting the lower boundary for prices (the same energy proof of value that underlies gold prices). As such, silver should be impacted by the same monetary drivers as gold prices: real-interest rate expectations, central bank policy, and longer-dated energy prices.
2. As silver is a commodity with extensive industrial applications, changes in industrial drivers (i.e. changes in available inventories) should impact the price of the metal.
This means that there is a strong relationship between silver prices and the level of economic activity on top of the impact that stems from the monetary environment. Hence, from that perspective, silver should underperform gold in a recession. As we believe that a recession is rather imminent – we have highlighted this in some of our reports over the past weeks – what does that mean for silver prices?
When we look at the historical ratio between gold and silver, it is indeed true that during the last five recessions, the gold-to-silver ratio (GTS-ratio) increased (see Exhibit 1). In three of those five instances we saw a very sharp upward move:
Exhibit 1: Gold outperformed silver over the last five recessions
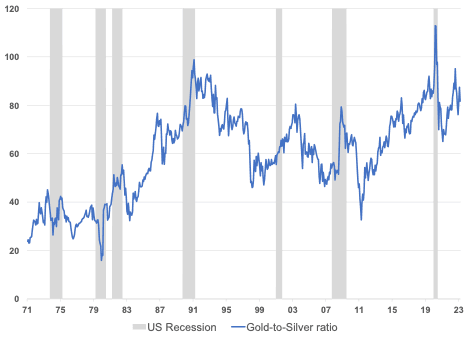
Source: Goldmoney Research
2020 COVID19 pandemic: Most governments opted for a similar response to the COVID19 pandemic by locking down large parts of their respective countries for weeks, in some instances months. This led to a sharp contraction in economic activity in 1H2020. During the initial phase of this rather unique recession, the GTS-ratio jumped from 85 to 112. This came mainly on the back of a sharp decline in silver prices from $18/ozt to $12/ozt, while gold prices increased only slightly from $1600/ozt to $1700/ozt.
2008 Great Financial Crisis: The GFC triggered a global recession that lasted two years from 4Q2007 to 3Q2009. During that time, the GTS-ratio went from 54 to 68. However, the GTS-ratio jumped as high as 80 in late 2008 at the peak of the panic in financial markets. While the move higher in the ratio was mainly due to the increase in gold prices, the peak in the ratio in late 2008 came on the back of a collapse in silver prices from $15/ozt prior to the recession to under $10/ozt.
The 2001 Dot.Com crash: The bursting of the Dot.com bubble lead to a recession that lasted from 1Q2001 to 3Q2001. During that time, the GTS-ratio moved only marginally higher from 55 to 63. This was mainly due to slightly higher gold prices while silver prices moved marginally lower. At the end of the recession, gold was trading at $290/ozt and silver at $4.50/ozt
The early 1990s recession: The recession in the early 1990s lasted from 4Q1989 to 1Q1991 in the US. During that time, the GTS-ratio shot up from 69 to 98. Gold prices remained more or less stable over the entire timeframe while silver prices declined from $5.30/ozt to $3.80/ozt.
The Recession of 1981–82: The recession of 1981 was the result of tight monetary policy by the Fed (and other central banks) in an effort to fight mounting inflation. The late 1970s early 1980s were plagued by double digit inflation. Fed chairman Volker drastically raised interest rates to over 20% which eventually brought inflation under control, but also triggered another recession. During the 1981-1982 recession, the GTS-ratio went from 41 to 55. Both gold and silver prices declined sharply during that period, but silver more. Gold went from $500/ozt to $300ozt and silver from $12.30/ozt to $5.30/ozt. It is important to highlight that these price corrections came after a decade of relentless rallies in metal prices on the back of high inflation (see Exhibit 2).
Exhibit 2: The decline in precious metal prices during the 1981-1982 recession followed more than a decade of rising prices on the back of relentless inflation
CPI y-o-y, %
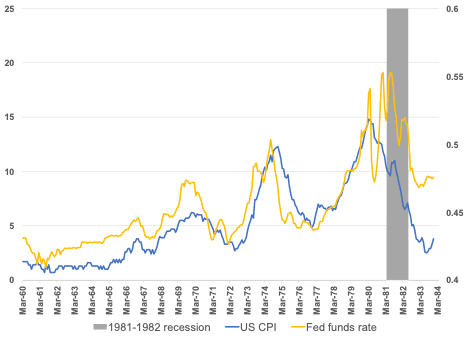
Source: FRED, Goldmoney Research
Hence, the last five recessions are very consistent with intuitive expectations. Gold consistently outperforms silver in those recessions as physical silver demand for industrial applications tends to decline. This seems true whether gold prices rise or fall. It’s important to notice that only in one instance gold prices rose, and only marginally. In most instances, the GTS-ratio rose because silver prices suffered. Thus, as in our view the world is on the cusp of another major recession, it seems reasonable to expect that the ratio once again will go up.
However, it turns out there have been two post-WWII recessions where this assumption didn’t entirely hold:
The recession from 1979-1980: When looking at the economic data of the late 1970s early 1980, one could come to the conclusion that there was a period of over 3 years where the US economy was in a continuous recession. However, it is important to distinguish between the 1981-1982 recession on the back of the Volker rate hikes and the economic downturn that preceded it. The 1979-1980 recession started officially in 2Q1979 and ended in 2Q1980. The mainstream view for what caused this recession is that the Iranian revolution in 1979 led to a global oil shortage which in turn caused a sharp rise in inflation. However, this narrative ignores that inflation was running rampant long before the Iranian revolution.[1]
The recession from 1973-1975: The recession that started in 4Q73 and lasted until 1Q75. There were a number of challenging factors that led to this recession, such as the deficits created by the Vietnam war and the first oil crisis on the back of the Saudi led oil embargo. As with the one that followed, the 1973-1975 recession was characterized by very high inflation. CPI inflation crossed 5% in early 1973 and moved as high as 12% in 1974. It’s hard to say how much of that is the delayed result of Nixon’s decision to abandon the gold standard, and how much was on the back of the oil embargo. But unlike the Iranian oil shock that followed, the first oil embargo led to a permanent upward shift in oil prices.
Importantly, what both recessions have in common is double digit inflation. And, in both these high-inflation recessions, the GTS-ratio behaved differently than it did in the recessions that followed. Arguably, over the entirety of either recession, gold again did outperform silver, even though only marginally. However, in the early part of both high-inflation recessions, silver vastly outperformed gold (see Exhibit 3). In the early parts of the 1973-1975 recession, the GTS-ratio went from 38 to as low as 26. This happened as silver prices more than doubled while gold prices went up by “only” 50%. Silver’s outperformance was even more pronounced in the first half of the 1979-1980 recession, with the GTS-ratio going from 32 to under 16. During that time, gold prices doubled, but silver prices quadrupled from $7.4/ozt to $32.0/ozt (over $48/ozt intraday).[2]
Exhibit 3: Both 1970s recessions saw a strong initial silver outperformance over gold amidst double-digit inflation.
Year-over-year change in the GTS-ratio, LogN
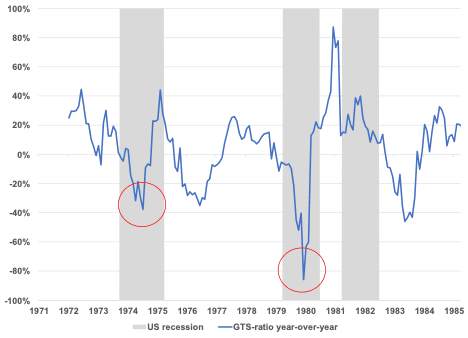
Source: Goldmoney Research
As we have explained in our silver price framework, while the GTS-ratio has steadily increased over long time periods, silver tends to outperform gold in bull markets. In our 2017 report we stated:
While gold may be better-suited for steady long-term savings, silver can be more efficient for gaining exposure to changes in monetary policy, particularly around industrial cycles. Changes in central bank policies have a 1:1 impact on the price of gold over the long run, meaning that the loss in purchasing power of the base currency of measurement is offset by the price increase. Therefore, gold can maintain its purchasing power in the long term, something no currency has ever been able to do throughout history.
When it comes to silver, changes in central bank policy act like a combustive agent on the price, making silver more efficient for someone with a view on the direction of policy-driven impact on currencies who aims for maximum exposure (see Exhibit 4).
Exhibit 4: silver tends to outperform gold when central bank policy is supportive for precious metals
$/ozt
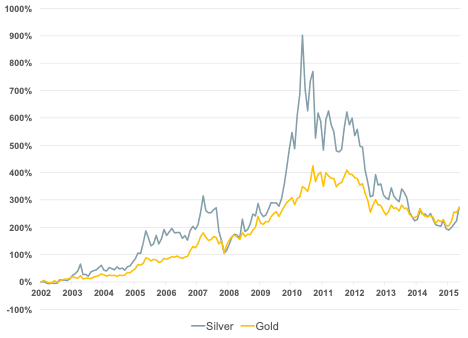
Source: Goldmoney Research
However, in both of the 1970s recession, the Fed increased rates. So, why did silver still outperform gold when both industrial demand weakened (as it does in any recession) AND the Fed raised rates? The answer is that inflation outpaced the Feds rate hikes. Yes, the Fed raised rates, but it did not raise it enough to successfully combat inflation. As a result, inflation not just persisted but accelerated. It is therefore important that we don’t look at the Fed policy in isolation, but relative to inflation. And relative to inflation, the Fed was easing.
Unfortunately, at the time Treasury Inflation Protected Securities (TIPS) weren’t introduced yet. The yields on TIPS are the markets’ expectations for real-interest rates over the coming years. For example, the 10-year TIPS yield as of today is 1%, meaning the market expects nominal yields on 10-year treasuries to exceed inflation by 1% over the next 10 years. Both gold and silver do really well in an environment of negative real-interest rate expectations (see Exhibit 5). While we don’t have data for TIPS yields for that period to prove it, it appears that during both recessions in the 1970s, real-interest rate expectations became negative (despite very high nominal rates), which created strong monetary demand for precious metals.
Exhibit 5: there is s strong inverse correlation between real-interest rate expectations and silver prices
$/ozt (LHS); 10-year TIPS yield % (RHS)

Source: Goldmoney Research
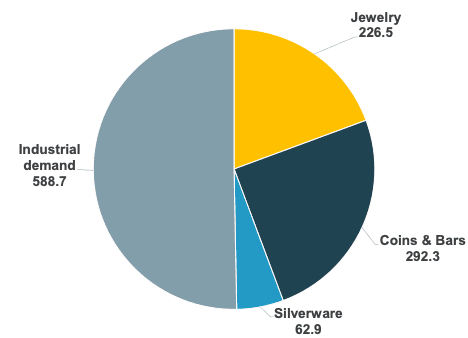
As we have explained in our silver framework report, the importance of demand for silver in industrial applications leads to an important difference between gold and silver. For thousands of years, above ground gold stocks have grown at the same pace as new gold was mined. But silver stocks grew much more slowly because industrial demand absorbed a large part of what was mined. We estimate that about half of all the silver ever mined has been irrevocably consumed. Hence, while there are about 190,000 tonnes of above ground gold stocks worth about USD10 trillion at current prices, the value of all above ground silver stocks is far lower.
Estimates for silver stocks are harder to come by. We found estimates for total above ground silver stocks ranging somewhere between 550-850 thousand tonnes. Taking the average of that, the ratio of above ground silver to gold stocks is about 4:1 measured by weight. Compare this to the annual production volume of both metals, which averaged around 9:1 over the past 10 years. The natural abundance of both metals in the earth’s crust is even further apart at 20-25:1 according to most studies and our own estimate for the economic geology of prime deposits puts this number closer to 1:40. As one can see, above ground silver stocks have not grown nearly as much as production or natural abundance imply, because much of the mined silver has been consumed (see Exhibit 6).
Exhibit 6: Industrial demand for silver is high, thus, above ground stocks grew much slower than above ground gold stocks
Million ounces, 2015
Source: Goldmoney Research
Therefore, silver prices are driven by monetary demand as well as supply and demand for industrial purposes, the latter of which is an important differentiator. Above ground gold stocks have always grown at the same pace as new gold is mined, dampening the effects of inventory-determined price volatility; however, silver stocks grew much more slowly as industrial demand absorbed a large part of what is mined.
This means that during periods of strong monetary demand for precious metals, there are far fewer silver stocks to absorb that demand. This means that in a recession where real-interest rate expectations move sharply lower, monetary demand can offset the weaker industrial demand and, consequently, silver prices can outperform gold. As both of the 1970s recessions have shown, both metals were in a bull market. It’s unlikely to see silver outperform gold in a recession with falling precious metals prices.
So what is it going to be this time? Over the past months we have stated in several reports that we expect the world to enter a recession. The question is how central banks and the Fed are going to react to this. The gold market and to some extent equities except the Fed to perform a sharp U-turn early on, either on the back of weaker economic and labor data or in case the crisis in the banking sector flares up again. Weaker economic activity would also ease tightness in commodity markets, effectively reducing the pressure on the Fed to address inflation with higher rates. However, we think the market is currently too complacent about the risks that the Fed remains hawkish for longer. The Fed is guided by core consumer price inflation, which is mostly driven by the services sector. Unlike in the commodity space, where for example oil prices retreated by around 40% from peak, we have yet to see an easing in inflationary pressure in the service sector. Wages are still running hot and there is no substantially increase in unemployment. Thus, the risk is that contrary to market expectations, the Fed will continue its hawkish stance for the coming months.
While we agree with the market that over the long run the Fed will revert to lower rates and resume QE, there is a substantial risk for the real-interest rate expectations to rise again in the near term while longer dated energy prices decline. Both are bearish precious metals prices, but it is worse for silver than gold. However, we think that in the bullish period that follows, silver may again outperform gold.
[1] The average CPI for the five years prior to the Iranian revolution was 7.73%. It also fails to explain why oil prices fell back to pre-revolution levels a few years later while overall price levels nearly doubled over that timeframe. While oil prices certainly played a role in the wild price fluctional of the late 1970s, we would argue that it was the monetary environment that led to the permanent upward shift in prices.
[2] The 1980 peak in silver prices was also the result of a silver squeeze on the back of the Hunt brothers massive position in the futures markets.