Market Report: Seasonal Rallies In Gold And Silver
Dec 28, 2018·Alasdair Macleod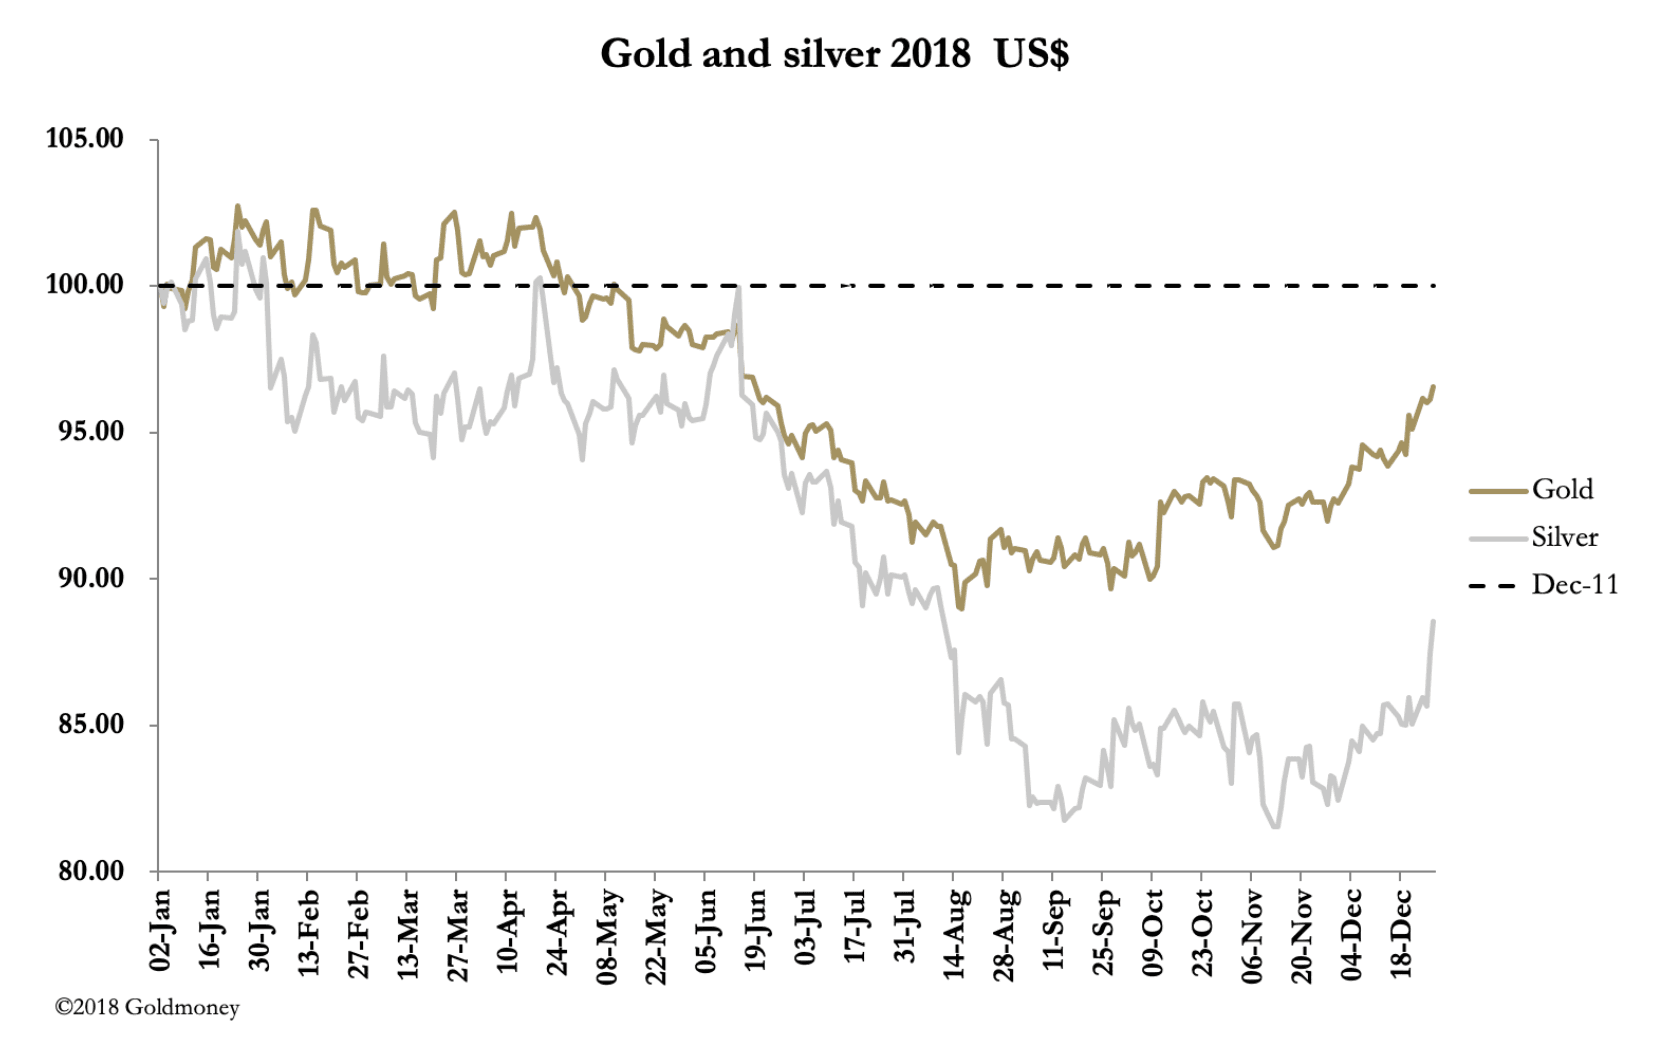
Despite the thin trade, gold’s open interest on Comex has increased by about 50,000 contracts since the December contract rolled off the board, telling us that we are shifting from bear-closing towards genuine buying. The same is not yet true of silver, which still looks and acts like a bear squeeze. The next chart shows gold’s open interest and price.
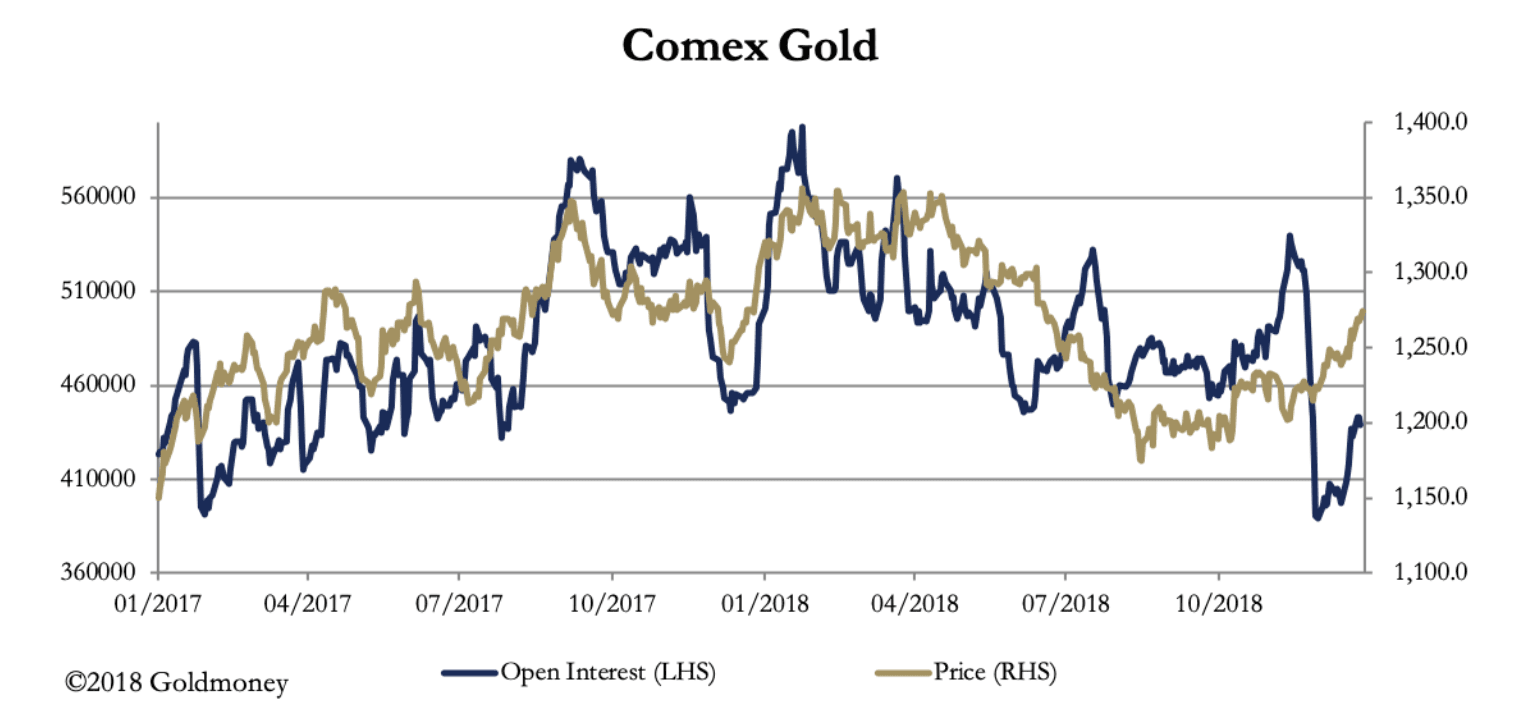
Despite the recovery in OI so far, it is still on the low side. Therefore, it is reasonable to suggest the current rally in the price has much further to go before it becomes overbought.
Of course, 2018 has been all about the flight into the dollar, driven by interest rate disparities, particularly with euros and yen. However, the dollar appears to be losing its bullish momentum, as our next chart shows.

The TWI appears to have confirmed a weak broadening top formation ending the dollar’s excursion into new high ground in mid-November. Referring to Edward & Magee’s classic work on technical analysis, we find that this chart pattern is associated mostly with the 1929 crash, appearing on many stock charts.
In truth it is difficult to see how the dollar can collapse dramatically against other currencies, particularly the euro, unless there is a destabilising financial crisis in the Eurozone, triggering massive position covering. It is certainly possible, but not a given.
Gold in 2018 priced in dollars has now recovered all but $25 of its losses, which given the carnage in bond and equity markets has been a respectable relative performance. In other currencies, the outturn has been better, and our next chart shows the gold price in the four majors.

The final scores for gold are in GBP +4.5%, EUR +2.7%, USD -2.1% and JPY -3.7%. Unless, that is, there are significant changes during the rest of today and on Monday.
Our last chart shows gold’s technical position.

Gold appears to have broken decisively above both moving averages, and if it can hold current levels, a bullish golden cross will develop in the second week of January. However, we still need to see a clear break above the $1350 level to confirm that the 26-month consolidation of gold’s initial move up from $1050 has completed. That being the case, gold can be expected to rise rapidly thereafter to challenge the 2011 highs close to $2,000.
If such a move were to develop, it would be consistent with dollar weakness, rising price inflation and falling stock markets. Perhaps we are seeing early indications of this outcome in today’s financial markets.
I wish all my readers at Goldmoney and elsewhere a successful New Year.
The views and opinions expressed in this article are those of the author(s) and do not reflect those of Goldmoney, unless expressly stated. The article is for general information purposes only and does not constitute either Goldmoney or the author(s) providing you with legal, financial, tax, investment, or accounting advice. You should not act or rely on any information contained in the article without first seeking independent professional advice. Care has been taken to ensure that the information in the article is reliable; however, Goldmoney does not represent that it is accurate, complete, up-to-date and/or to be taken as an indication of future results and it should not be relied upon as such. Goldmoney will not be held responsible for any claim, loss, damage, or inconvenience caused as a result of any information or opinion contained in this article and any action taken as a result of the opinions and information contained in this article is at your own risk.