Market Report: Rollercoaster week for PMs
Oct 4, 2019·Alasdair MacleodGold and silver sold off this week, with gold trading down to $1459 intraday on Tuesday, and silver sold down to $16.89. Dollar strength based on the suspicion that the recent repo turmoil was to do with dollar shortages was the initial view, but then bad economic news implying gathering recessionary forces caused gold and silver to rally on Wednesday and Thursday. Gold traded at $1508 in early European trade this morning (Friday), up a net $10 on the week, and silver at $17.58, up a net three cents.

Fuelling the fall into the lows was the third-quarter end, when bullion banks like to ensure that their valuations appear as favourable as possible. On another interpretation, gold has completed an ABC correction, the A-leg being the first sell-off, the B-leg a counter-trend rally, and the C-leg the final sell-off. The overbought condition would have been relieved to a degree, and the bull phase can now continue.
That is undoubtedly what the bulls hope. Our technical chart puts it in perspective.

If the gold price can surmount the highs of early September, it could have enough momentum to test $1600, where one would expect a more significant correction to develop. But fundamentals are changing rapidly.
This week has seen new evidence of economies round the world slipping into recession. Yesterday morning, it was America’s turn with ISM Services data coming in well below expectations, joining poor manufacturing numbers, and forward-looking indicators are suggesting further momentum could be lost in the fourth quarter. The Dow lost 800 points Monday to Thursday, the most serious slide since the first week in August.
Behind it is a collapse in bond yields, indicating a recession. Our last chart is of the US Treasury 10-year bond.
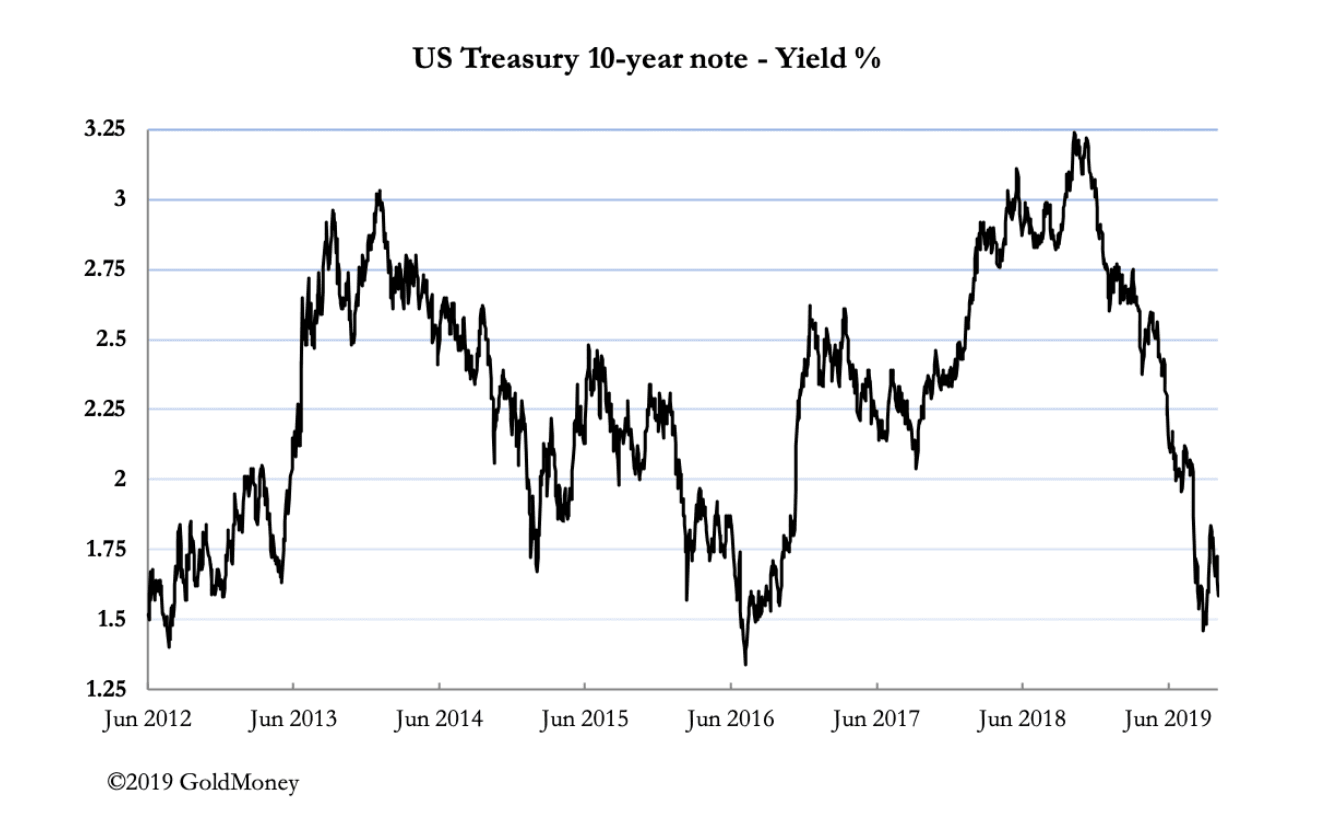
The slide in this bond’s yield has been spectacular, last night closing at 1.536%, well below overnight rate levels, with the Fed Funds Rate target standing at 1.75-2.00%. Clearly, financial markets expect dollar interest rates to go much lower in the coming months.
If rates do go lower, it will obviously be bullish for gold and silver, which fits in with what the technical charts suggest.
In other news, Brexit negotiations are entering the final stages. If the EU allows a “no deal” Brexit to materialise, it will be a severe blow for the Eurozone economies, which are already struggling. Germany in particular is already in recession, with life-threatening conditions for the major German banks. Clearly, on top of all their other troubles, a recession looks almost certain to result in a banking crisis for one or more of the majors, a situation which may be behind the repo mess in New York, with US banks unprepared to take on counterparty risk.
The views and opinions expressed in this article are those of the author(s) and do not reflect those of Goldmoney, unless expressly stated. The article is for general information purposes only and does not constitute either Goldmoney or the author(s) providing you with legal, financial, tax, investment, or accounting advice. You should not act or rely on any information contained in the article without first seeking independent professional advice. Care has been taken to ensure that the information in the article is reliable; however, Goldmoney does not represent that it is accurate, complete, up-to-date and/or to be taken as an indication of future results and it should not be relied upon as such. Goldmoney will not be held responsible for any claim, loss, damage, or inconvenience caused as a result of any information or opinion contained in this article and any action taken as a result of the opinions and information contained in this article is at your own risk.