Market Report: Is this a major turning point?
Oct 12, 2018·Alasdair Macleod
We need to look at this week’s performance in a wider context. Yields on US Treasuries rose sharply, and a number of analysts issued research notes forecasting even higher yields to come, based on technical analysis. It triggered a sharp slide in equities, with the Dow falling 1,400 points (5.3%) in only two trading sessions, and the dollar lost ground as well. In recent weeks, extreme speculative positions across a number of markets had built up: short precious and base metals; short euro, short US Treasuries, all long dollar. It required little to trigger a dramatic reversal.
The current consensus appears to be the global economy and the major currencies in particular are in a low-inflation, low-interest rate environment, which shows no sign of ending. If so, the post-Lehman financial stability can continue, and the cost of funding debt expansion remains low. If not, the most immediate effect will be to change perceptions for the future of government finances.
Yesterday, I posted a Goldmoney Insight examining the current market, financial and economic situation, and I concluded that the long-term credit cycle is on the turn. Higher interest rates will undermine confidence in governments’ economic management and their ability to fund at affordable rates. Inevitably, questions will be raised over the future value of fiat currencies. I argue that there are similarities developing with the 1970s, when the Fed Funds Rate rose from a benign 5% to over 19%. Even half that rise would be destabilising for the dollar, because of the damage to government finances. Key to this reassessment is price inflation, which is currently only subdued by official CPI statistics, but in reality, is higher. In the seventies, gold rose 24-fold as confidence in the almighty dollar waned. It could happen again.
That being the case, the sell-off in gold from $1350 last April to under $1200 cannot be interpreted as continuing bear market. Rather, it is an opportunity to acquire a deeply unfashionable asset. It is in this light that we need to read the following chart.
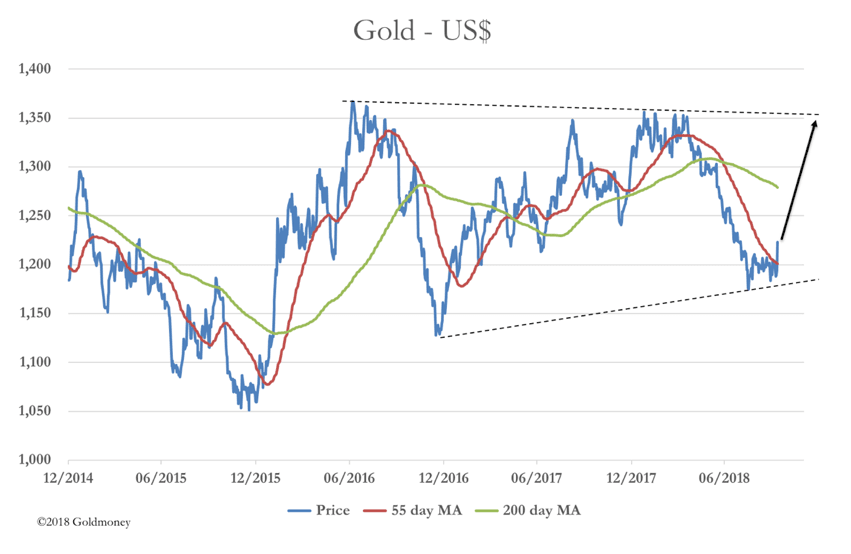
Technical analysis increasingly points to the move from July 2016 being a three-leg consolidation of the previous move up from the $1050 low. With gold extremely oversold, it certainly has the potential to rally from here, perhaps as far as the $1350 level which it will need to break through to confirm the consolidation pattern, which is delineated between the pecked lines. If this 26-month consolidation is confirmed, its shape suggests the move into the next bull leg will be rapid.
The views and opinions expressed in this article are those of the author(s) and do not reflect those of Goldmoney, unless expressly stated. The article is for general information purposes only and does not constitute either Goldmoney or the author(s) providing you with legal, financial, tax, investment, or accounting advice. You should not act or rely on any information contained in the article without first seeking independent professional advice. Care has been taken to ensure that the information in the article is reliable; however, Goldmoney does not represent that it is accurate, complete, up-to-date and/or to be taken as an indication of future results and it should not be relied upon as such. Goldmoney will not be held responsible for any claim, loss, damage, or inconvenience caused as a result of any information or opinion contained in this article and any action taken as a result of the opinions and information contained in this article is at your own risk.