Market Report: Gold support establishing at $1280
Jan 25, 2019·Alasdair MacleodAfter failing to break the $1300 level, gold backed off to find support at $1280, and silver dutifully eased as well. From last Friday’s close, after an $11 fall that day gold traded sideways to end up $1 higher on the week at $1283 in European trade this morning. On the same timescale silver rose three cents to $15.37.

Comex volumes have been generally light in a week when Monday was a public holiday in the USA for Martin Luther King Day. The dollar has also been in a holding pattern as the next chart of its trade weighted index shows.
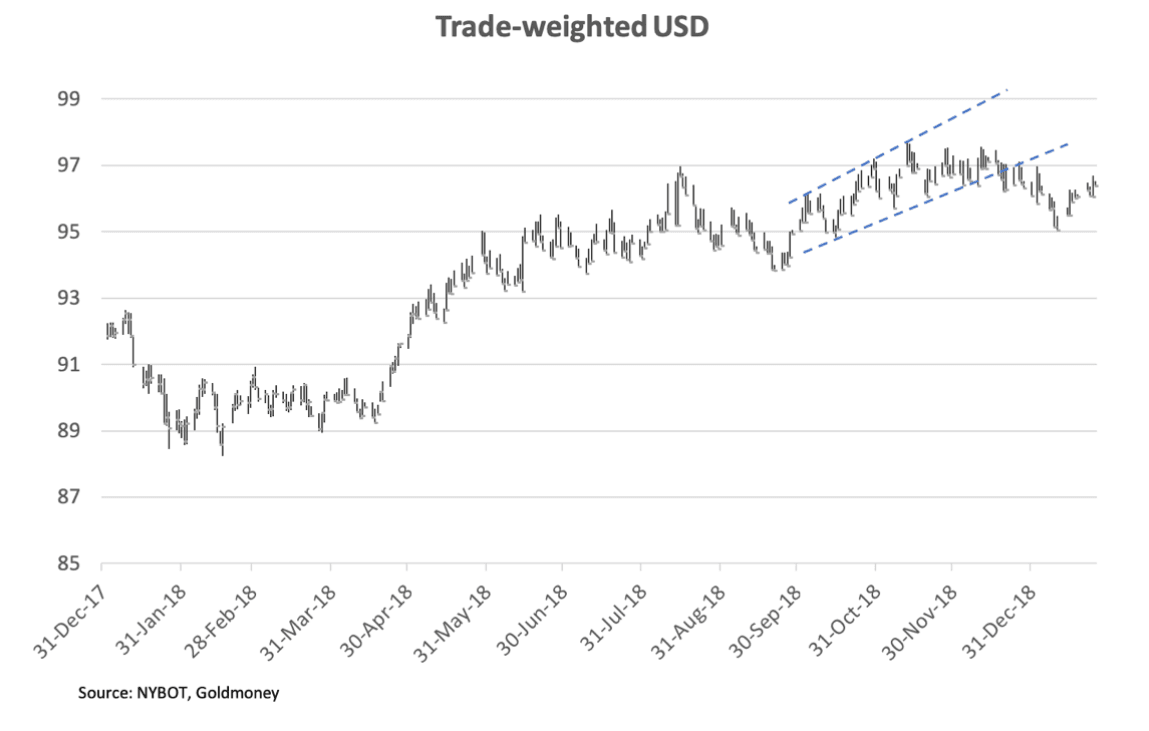
While the broadening top formation in Q4 last year shows inherent weakness, it is clear that for the moment the 95 level is established as important technical support.
Our third chart updates the technical situation for gold.
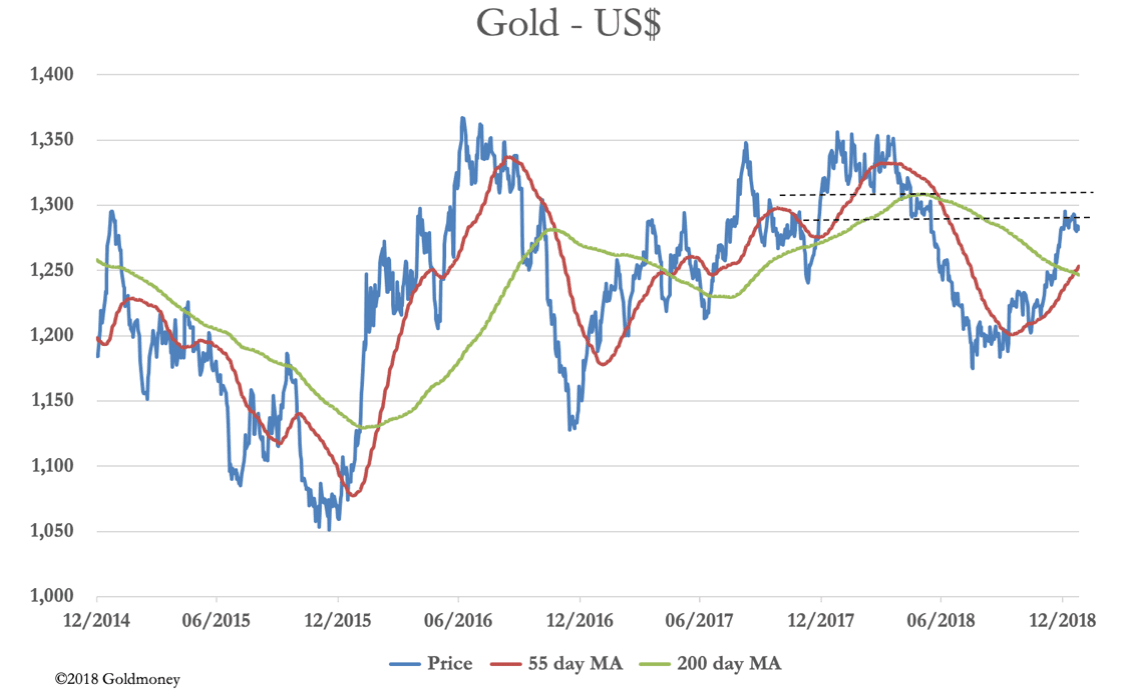
The bullish golden cross, with all the elements in correct sequence has now taken place. The current consolidation appears to be building into a launchpad for an assault that will take gold above the $1300-1310 resistance band, in which case a run up to test $1350-1360 will be in prospect.
A note of caution perhaps should be introduced. This is shown in our next chart, of gold’s open interest on Comex. The February contract is running off the board, which normally leads to a fall in open interest. Instead, it continues to rise strongly.

We are somewhat in the dark here, because the Commitment of Traders data are not being released due to the government shutdown and we cannot see who owns the contracts. Unless it is the swaps selling physical and/or forwards in London to arbitrage into Comex contracts, it suggests an overbought market due for a technical reaction, perhaps to test the $1250 level.
Time will tell. In other news, Hitachi has pulled the plug on a nuclear project in North Wales because it has become uneconomic. The relevance here is for silver, the vital ingredient for solar panels. It appears that the cost of renewable energy has fallen significantly below that of nuclear, which is why solar farms are springing up everywhere.
With estimates of a slight decline in mine production for 2019 and escalating demand from the solar industry, silver looks cheap. To help quantify the opportunity, our last chart shows the gold/silver ratio.
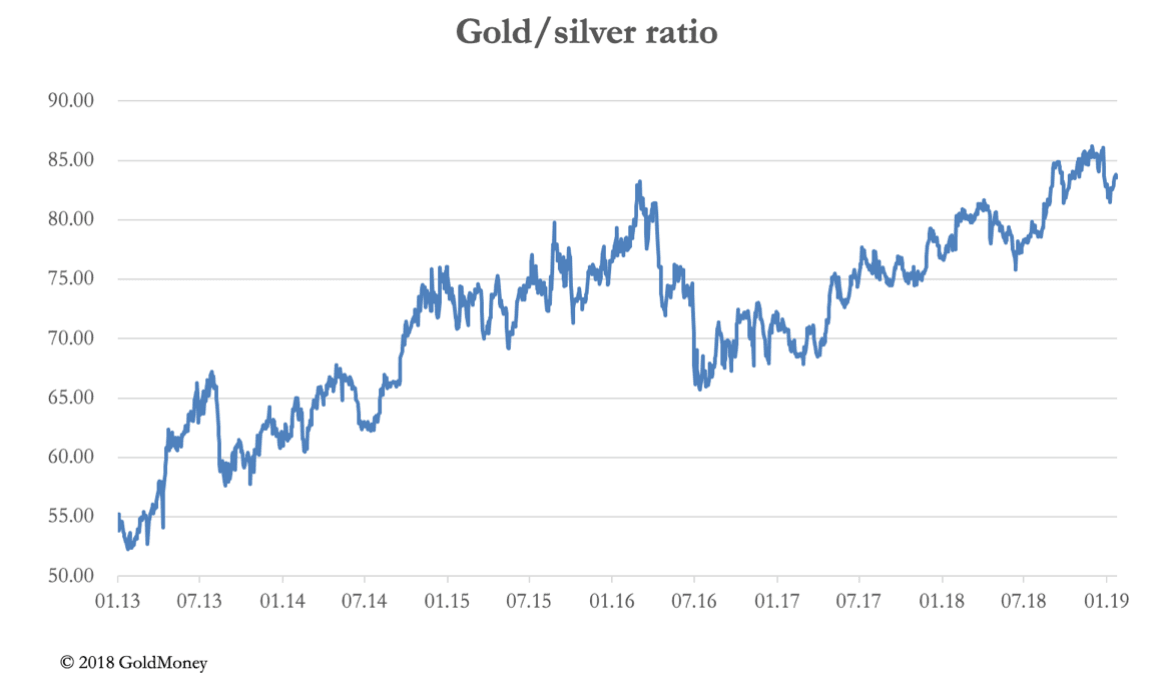
Currently standing at 83.7, silver is still reflecting the massive bear market relative to gold since its price peak in 2011, when it hit $50. Could silver be the next palladium, which has tripled on acute physical shortages since 2016?
A last note on the global economic outlook, which has deteriorated rapidly over the last month. The ECB has confirmed it is ready to do whatever it takes to stop a new recession. Of course, it is likely to fail, but the message for currencies is clear: there’s a new round of monetary expansion in the offing, which is the underlying justification for being bullish over gold.
The views and opinions expressed in this article are those of the author(s) and do not reflect those of Goldmoney, unless expressly stated. The article is for general information purposes only and does not constitute either Goldmoney or the author(s) providing you with legal, financial, tax, investment, or accounting advice. You should not act or rely on any information contained in the article without first seeking independent professional advice. Care has been taken to ensure that the information in the article is reliable; however, Goldmoney does not represent that it is accurate, complete, up-to-date and/or to be taken as an indication of future results and it should not be relied upon as such. Goldmoney will not be held responsible for any claim, loss, damage, or inconvenience caused as a result of any information or opinion contained in this article and any action taken as a result of the opinions and information contained in this article is at your own risk.