Market Report: Gold’s Comex open interest bullish
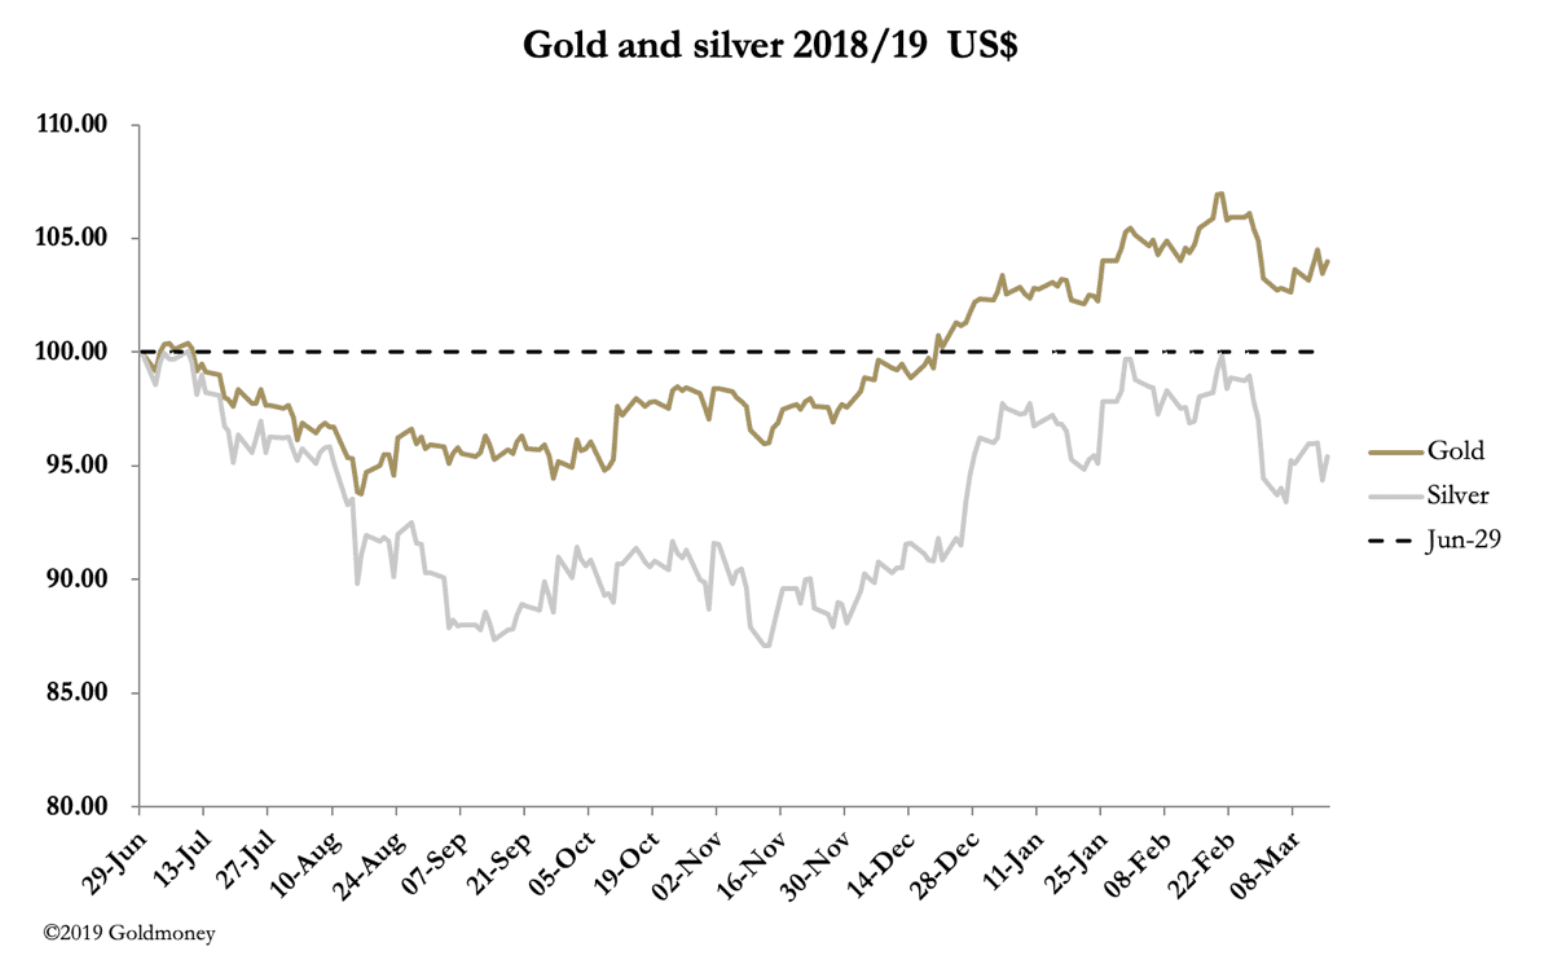
Mar 15, 2019·Alasdair MacleodThis week, gold and silver consolidated at established support levels after their recent slide, having recently tested the $1350 and $16.20 respective supply levels. In European trade this morning (Friday) gold was trading at $1303, up $10 from last Friday’s close, and silver was trading at $15.36, up five cents. Comex volumes for gold were healthy rather than spectacular and for silver were moderate.
It is notable that gold’s open interest on Comex has increased by 65,000 contracts in the last eight trading sessions, the equivalent of 202 tonnes. This is despite the April contract beginning to wind down, and indicates firm buying by hedge funds, some of which have been accumulating longer-dated futures. At the same time, the put/call ratio on June options is two to one in favour of puts, with not much of note in the other series.
Taken together, it appears the hedge fund buyers are not so much speculating, but more likely to be taking strategic positions. That would account for much of the increase in open interest. A put/call ratio of two for a mid-year contract expiry suggests existing long positions are being hedged. These are not necessarily hedging positions on Comex, but could be on other markets, or even in physical ETFs.
The picture painted is one of changing views in the managers of big money, not yet bullish for gold, but aware they should be adjusting towards a “risk-on” investment strategy.
Our next chart, taken from Commitment of Traders Reports (which are now up to date) should be viewed in this context.
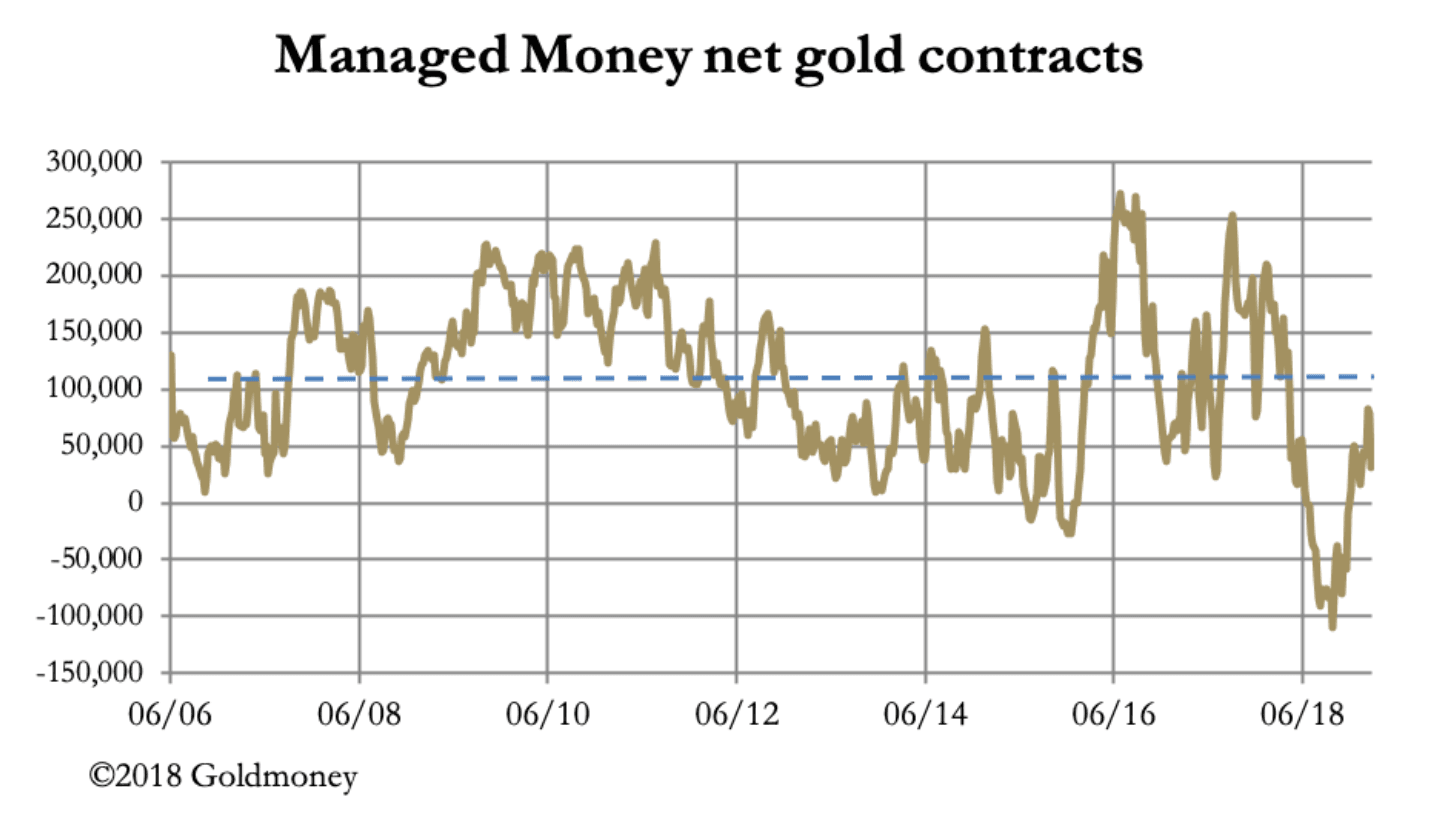
The last data input was for Tuesday 5 March, coinciding with the low point in open interest. The move from a record short position to net long only 32,000 contracts (the long-term average is shown by the pecked line at 110,000) represented a bear squeeze. The recent increase in OI should take net longs back up to between 50,000 – 100,000, suggesting there is some heft behind the current rally. This is now better-quality buying.
Therefore, we can be more confident that dips below the $1300 level will be short-lived. That being the case, there is a strong possibility the price will mount a new challenge on the $1350 level next month, when the current active contract has expired. The technical position is shown in our third chart.

Gold found support at the 55-day MA, and from our analysis of the buying quality at this support level, a further decline to the 200-day MA appears unlikely. Both MAs are in bullish sequence and should support a move to test $1350. If that level is convincingly surmounted, then a triangular consolidation pattern from July 2016 will be confirmed. A resumption of the bull market should ensue, which could be quite rapid given the character of the thirty-month consolidation.
In other words, freed from current technical constraints, the gold price has some catching up to do. The apparent collapse in international trade growth and the likely effect on the dollar might have something to do with it.
The views and opinions expressed in this article are those of the author(s) and do not reflect those of Goldmoney, unless expressly stated. The article is for general information purposes only and does not constitute either Goldmoney or the author(s) providing you with legal, financial, tax, investment, or accounting advice. You should not act or rely on any information contained in the article without first seeking independent professional advice. Care has been taken to ensure that the information in the article is reliable; however, Goldmoney does not represent that it is accurate, complete, up-to-date and/or to be taken as an indication of future results and it should not be relied upon as such. Goldmoney will not be held responsible for any claim, loss, damage, or inconvenience caused as a result of any information or opinion contained in this article and any action taken as a result of the opinions and information contained in this article is at your own risk.