Market Report: Breakout!
Jun 21, 2019·Alasdair Macleod
The moment gold bugs have been waiting for happened this week, with gold breaking higher out of its three-year consolidation on the upside. In European trade this morning, gold was up $47 from last Friday’s close at $1389, having spiked up to $1412 in overnight Asian trade. Silver rose 22 cents to trade at $15.28, lagging the move in gold.
Precious metal prices are very volatile in these conditions. Furthermore, today is Quadruple Witching Day, which adds unpredictability, as traders try to stay the right side of option exercise prices.
Our next chart illustrates the technical position in gold.

When the breakout came, there was little doubt about the move. The three-year consolidation delineated between the two lines is now complete, and besides some potential profit-taking which could bring the price back to test the breakout level ($1360-70), looks set fair for a decent bull run. Moves of this sort occur when the majority of traders have taken the view that there is no point in buying until the pattern is complete. When it happens, inevitably it leads to a wave of buyers scrambling to go long. Traders move quickly, as we saw with the spike to $1412 overnight.
Meanwhile, major breakouts happen in overbought conditions. This is illustrated in our next chart, of gold’s open interest on Comex.
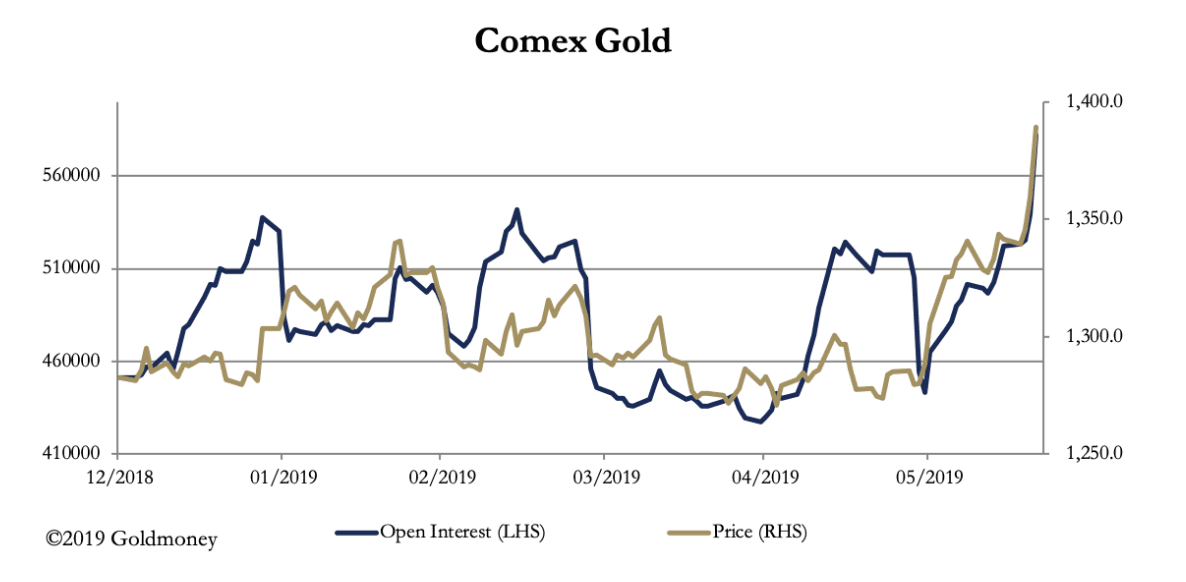
Based on preliminary figures, open interest last night soared to 582,121 contracts, a jump of 43,170 contracts. Volumes in both futures and options rose sharply.
Silver has been the reluctant metal and lost 18 cents from overnight levels at the time of writing. The next chart is of the gold/silver ratio, currently standing at 91.

Silver is behaving as if it is not yet in a bull market. In a bull market, it can be expected to rise at nearly double the rate of gold; in a bear market it falls at double gold’s pace. Instead, it is hardly keeping pace with moves in the gold price.
The trigger for gold’s jump was the widely expected guidance from the FOMC meeting on Tuesday and Wednesday, indicating an easing of the Fed funds rate next month. In the context of wider financial markets, this was not a surprise, with US Treasury yields extending a falling trend. Equities appear to be taking the view that Fed easing will underwrite the economy, and they have risen on a relative valuation basis.
This week has seen an escalation of tension between the US and America. Almost daily we hear news trending towards the outbreak of hostilities, and doubtless some commentators will claim it as a reason for gold’s strength. But it is worth pointing out that on the basis we live in a world of fiat currencies, it is the dollar which should be the safe-haven trade. This brings us to our last chart, of the dollar’s trade-weighted index.

The TWI is testing the lower trendline of an upward-sloping trend line, reflecting perhaps expectations of lower interest rates, and no suggestion yet of a safe-haven play.
The views and opinions expressed in this article are those of the author(s) and do not reflect those of Goldmoney, unless expressly stated. The article is for general information purposes only and does not constitute either Goldmoney or the author(s) providing you with legal, financial, tax, investment, or accounting advice. You should not act or rely on any information contained in the article without first seeking independent professional advice. Care has been taken to ensure that the information in the article is reliable; however, Goldmoney does not represent that it is accurate, complete, up-to-date and/or to be taken as an indication of future results and it should not be relied upon as such. Goldmoney will not be held responsible for any claim, loss, damage, or inconvenience caused as a result of any information or opinion contained in this article and any action taken as a result of the opinions and information contained in this article is at your own risk.