Market Report: $1300 breakthrough for gold
Feb 1, 2019·Alasdair MacleodGold and silver performed strongly this week improving on Friday’s sharp gains. As our headline chart shows, gold is back to the January 2018 level, while silver still has some catching up to do. Last Friday, gold rose $22 to close over the $1300 level, and this week it added a further $18.00 to $1321.50 by European trade this morning. Silver rose a more modest 22 cents on the week to $16.00.
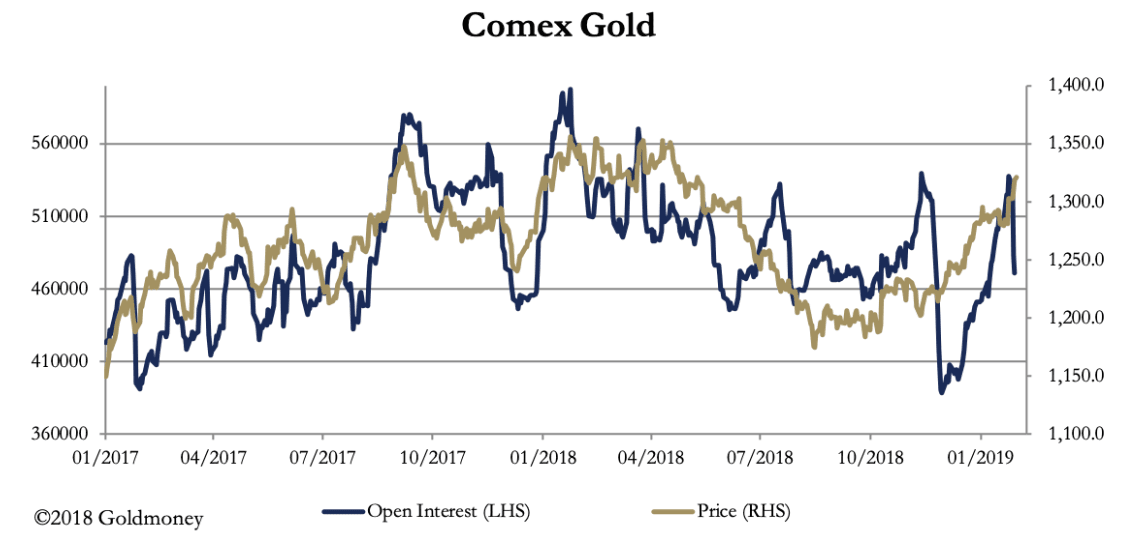
To have the price rise while open interest falls on a contract expiry is unusual, except in a bear-squeeze. This does not currently appear to be the case, with gold looking overbought. It tells us the bullion banks and the really large speculators are not prepared to risk their long positions by banging the price in the hope of frightening less robust traders out of their long positions.
We cannot fully confirm this conclusion in the absence of the weekly Commitment of Traders Reports, due to the government shutdown. Hopefully, we will have an update after hours tonight. If so, I shall tweet them on @MacleodFinance.
However, the FOMC’s more dovish tone confirms an increasingly positive sentiment for gold. This week, Jay Powell confirmed further rises in interest rates and quantitative tightening are placed on hold, and his tone in the press conference following the rate decision on Wednesday indicated an underlying concern for both the global economy and the implications for the US. It seems that the heads of other the major central banks are now more concerned that the business cycle is turning negative.
The problem for them is cuts in interest rates may not be enough to prevent recession. Instead, they are likely to resort to quantitative easing again, if the global economy continues to weaken. Markets are increasingly aware that the business cycle is long overdue a downturn, so it’s time to expect reflation instead of inflation. Hence, the change of mood for gold, which as recently as mid-November was deeply bearish.
The dollar’s trade weighted index is reflecting this switch in opinion, having appeared to complete an eight-month countertrend rally, as shown in our next chart.

While technical analysis has a high degree of subjectivity, this chart appears bearish for the dollar. With some initial support at 94, there is little to stop it sliding to test the lows of a year ago down to 89.
Our last chart is of gold over the last four years, showing the current rally in a longer-term context.

The price has powered through potential supply in the $1290-1310 band, illustrated by the dotted lines. That level should now be the limit of any correction, after which old highs stretching back three years at $1350-60 can be expected to offer more serious resistance to further gains.
The views and opinions expressed in this article are those of the author(s) and do not reflect those of Goldmoney, unless expressly stated. The article is for general information purposes only and does not constitute either Goldmoney or the author(s) providing you with legal, financial, tax, investment, or accounting advice. You should not act or rely on any information contained in the article without first seeking independent professional advice. Care has been taken to ensure that the information in the article is reliable; however, Goldmoney does not represent that it is accurate, complete, up-to-date and/or to be taken as an indication of future results and it should not be relied upon as such. Goldmoney will not be held responsible for any claim, loss, damage, or inconvenience caused as a result of any information or opinion contained in this article and any action taken as a result of the opinions and information contained in this article is at your own risk.