Long term oil prices beginning to reflect the coming oil shortage – Part II
Apr 8, 2022·Goldmoney InsightsIn this two-part report we analyse the recent moves in oil markets. In the first part we explained the drivers behind the strong rally in prompt oil prices over the past year. In this second part we will take a deep dive into the drivers behind the move in long-dated oil prices and why we think this is just the beginning of a multi-year repricing of the entire forward curve.
In the first part of this report (see Long term oil prices beginning to reflect the coming oil shortage – Part I, 28. March 2022) we explained in detail how we got to the current oil price shock (see Exhibit 1).

In a nutshell, after the oil crash in early 2020 on the back of the first global Covid19 lockdowns, OPEC+ members agreed on the largest production cuts in history. As global oil demand began to recover, OPEC+ decided to bring back supply slowly, leaving the market in deficit in order to bring elevated global inventories back to normal. However, for the past months, actual OPEC output is below the official target as many OPEC members are plagued with domestic issues that prevent full production.
Interestingly, the core OPEC members Saudi Arabia UAE and Kuwait are for once not stepping in to fill the gap. In our view, this may be partially politically driven due to some tensions between the US and some OPEC members, but more likely it is also due to their own capacity constraints. While Saudi Arabia and other core-OPEC members are still producing below their sustainable capacity, these countries can’t really step in and fill the production gaps left by the less stable OPEC producers, as it would mean they could not increase production anymore when they are supposed to, according to the OPEC+ roadmap. They have no choice then to stick to their own predetermined production path.
To make matters worse, US shale producers, once thought to be able to produce as much crude as needed, seem completely resilient to the latest price rally. After a decade of persistent losses in the pursuit of growth, the shale oil industry received clear warnings from banks, equity and bond markets. Thus for the past year, the US shale oil industry focused solely on profitability, which meant to stick to production guidance even as prices doubled. And they seem determined to not continue on this path in 2022. At $60/bbl expectations were that US shale companies grow production in 2022 by about 700-800kb/d. At $100/bbl, those expectations are still largely unchanged. It seems the days of >2mb/d production growth per year are gone forever (see Exhibit 2).

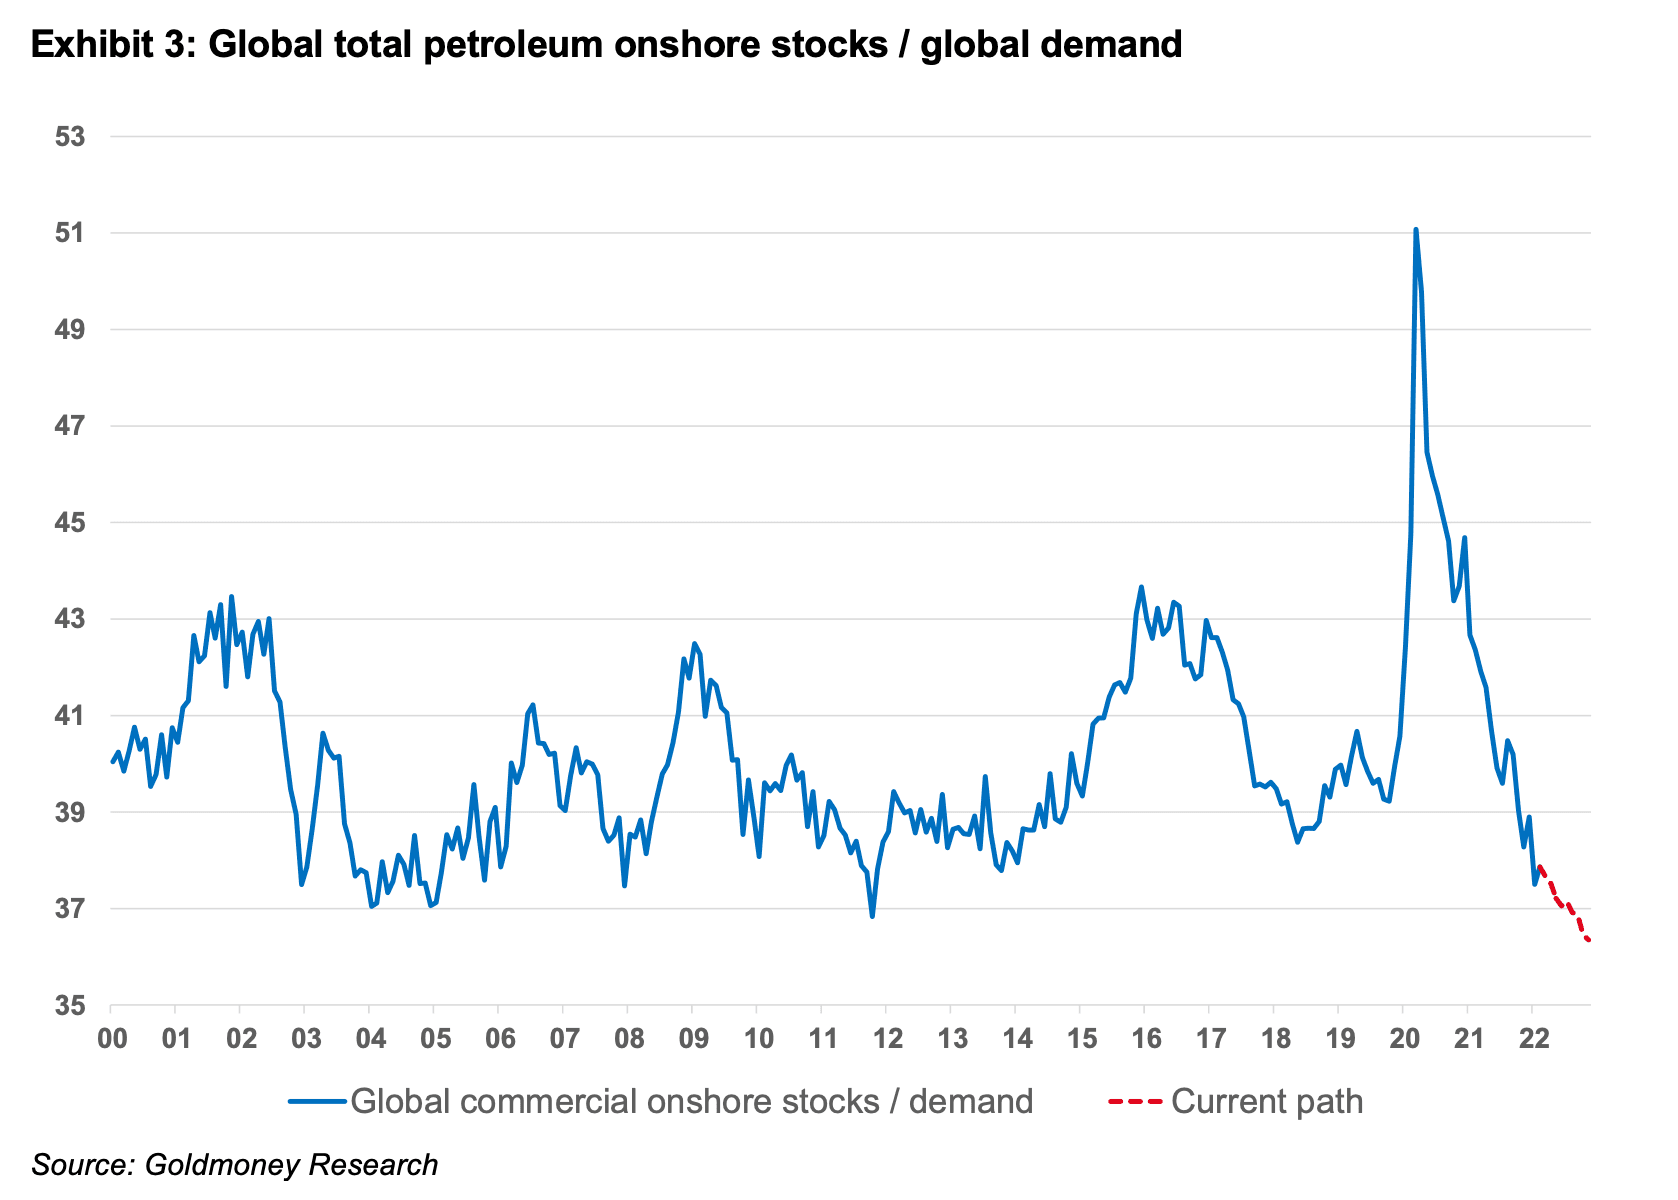
As a result, global demand continued to exceed production in 1Q22 at a time when in theory, we should have shifted to an oversupplied market. This meant that global oil inventories fell near their all-time lows relative to demand (see Exhibit 3) and the curve became extremely backwardated, meaning prompt prices trade at a large premium to deferred prices[1].
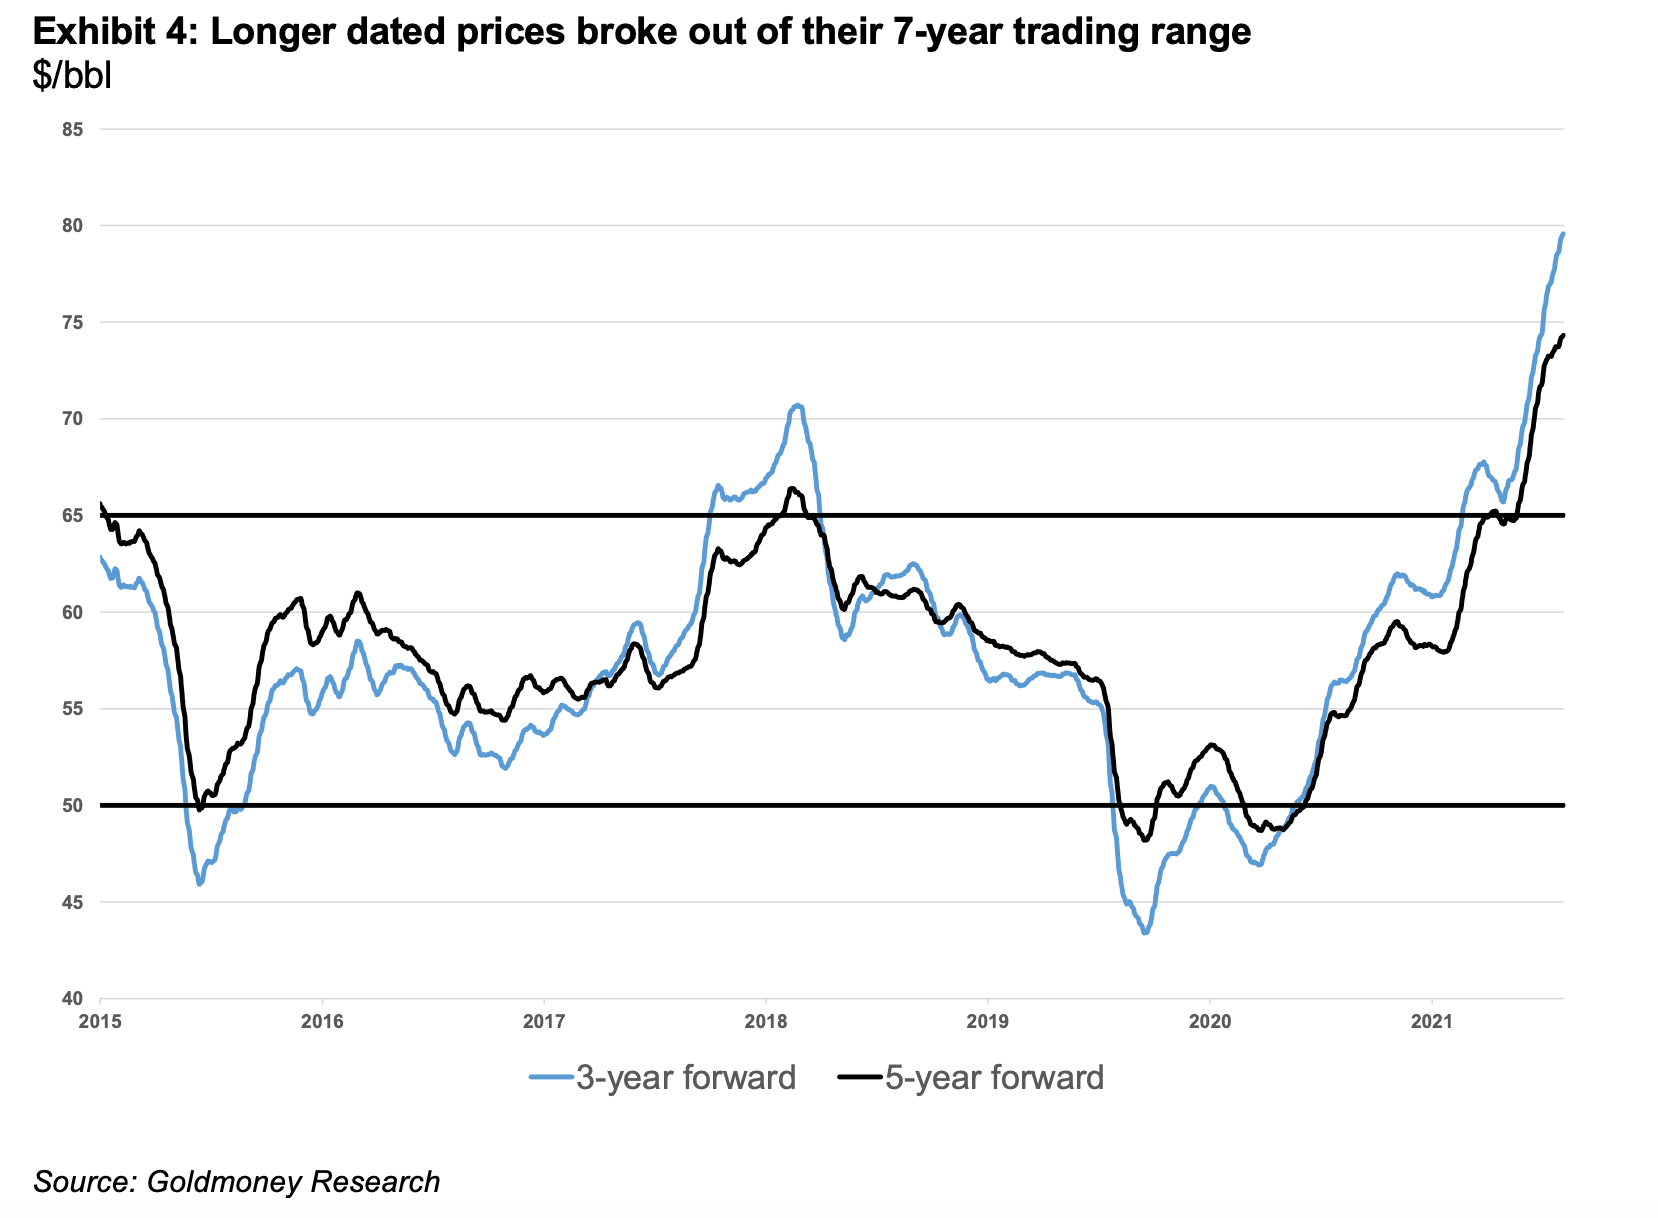
So it appears at first that the recent crude oil price spike was mainly the result of a curve being pushed into a steep backwardation (due to very low inventories) on the back of near-term supply issues. But that is not the whole picture. We think the more interesting story has been developing quietly at the long end of the curve. Longer-dated prices have broken out of their $50-65/bbl range they have been trading for the past seven years (see Exhibit 4). While short term price fluctuations are usually simply a function of fluctuating inventories, long term prices reflect the industry’s marginal cost of future supply.
Longer dated prices have been on a structural decline since the great recession in 2008 (see Exhibit 5). First it was the prospect of a prolonged period of low growth in the aftermath of the credit crisis that pushed longer dated prices lower. If demand was to grow at a slower pace because long-term global growth prospects looked dim, then the highest cost projects (such as Canadian oil sands, arctic oil and very complex oil projects) would no longer be needed, and the world could be entirely supplied with more conventional, cheaper oil projects. As a result, longer dated oil prices hovered around $100 for a few years (as opposed to $140/bbl at their peak in 2008). Just as those growth fears dissipated, the shale oil revolution changed the industry forever. A second oil crash happened from 2014-2015 which brought longer-dated prices even lower. At the end, the market began to price in that at $50-65, US shale oil producers could supply the world with all the oil it would ever need. However, since 2021 we are witnessing a break-out of longer-dated prices from this trading range.

So what is driving this? As we mentioned earlier in the report, the short end of the curve is driven by inventories. The long end of the curve is driven by marginal costs of future supply. So why is the market now suddenly pricing in that marginal costs of supply are rising? We think it is a mix of two things. On one hand the market begins to realize that current cost inflation for production is likely not a temporary phenomenon. On the other hand, it dawns to the market that we are going to face supply issues over the coming decade. In the remainder of this report we will take a deep dive into both of these drivers for marginal cost of future supply.
Production cost inflation unlikely to be just transitory
General inflation has been skyrocketing this year. US core price inflation (core excludes energy prices) is at a staggering 6.4%, CPI headline inflation is at 7.9% and Producer Price Inflation (PPI) for finished goods is at a whopping 13.8% (see Exhibit 6).

A lot has been written by economists and in the media about the source of this inflation over the past months. Some argue it’s simply due to supply chain disruptions on the back of worldwide Covid mandates and lockdowns that impacted raw material production, manufacturing and shipping. Some of that is likely true, and as mandates ease, the inflationary pressure from supply chain disruptions will somewhat abate, especially if we are heading into a recession. More important in our view is the phenomenon of excess spending on certain goods that occurred during the pandemic. The lockdown resulted in people having more disposable income and ordering goods online which they wouldn’t have otherwise (see Exhibit 7). This was exacerbated by various forms of Covid relief payments by governments across the world. It appears that people globally spent their money on similar product groups, lots of them manufactured in the Far East. This lead to manufactures struggling to keep up with demand and created shipping bottlenecks. As mandates will gradually be lifted, stimulus checks stop and normalcy returns, those goods flows will abate as well and inflationary pressures will disappear and potentially even reverse. Disposable income per capacity has largely normalized and has now fallen below trend (see Exhibit 7). In other words, inflation pressure from elevated disposable income is coming to an end. And as the Fed is raising rates to combat inflation just as excess spending is ending, this might be just what it takes to push the economy into recession.

Importantly, the inflation created by supply chain disruptions and stimulus driven demand are more important for short term inflation (and thus prompt oil prices) and not long tern inflation.
However, there is also the third driver for inflation which is impacting long term inflation expectations, and it’s not transitory in our view. Central banks have been de facto printing money at large scale since the great recession. The fed alone bought roughly 3.5 trillion in assets (mostly treasury bonds) between 2008-2014, also known as quantitative easing (QE). Most other major central banks had or still have similar polices. Only 10 years after it experimented with QE for the first time, the Fed ever dared to try unwinding that balance sheet, but after selling about $700 billion back between 2018 and 2019, turmoil in the repo market forced the Fed to take a hard turn and buy assets at a faster pace than ever before. By the end of 2019 (before Covid was a household name), the Fed was basically back to square one. Since then things have only gotten more extreme and currently there are $9tn of assets on the Feds balance sheet (see Exhibit 8). Other central banks have yet to show any attempt to unwind their balance sheets.
 Many economists continue to argue that these assets purchases are not per se inflationary. They point to the lack of a spike in CPI inflation in the 10 years prior to the pandemic as evidence (see Exhibit 9).
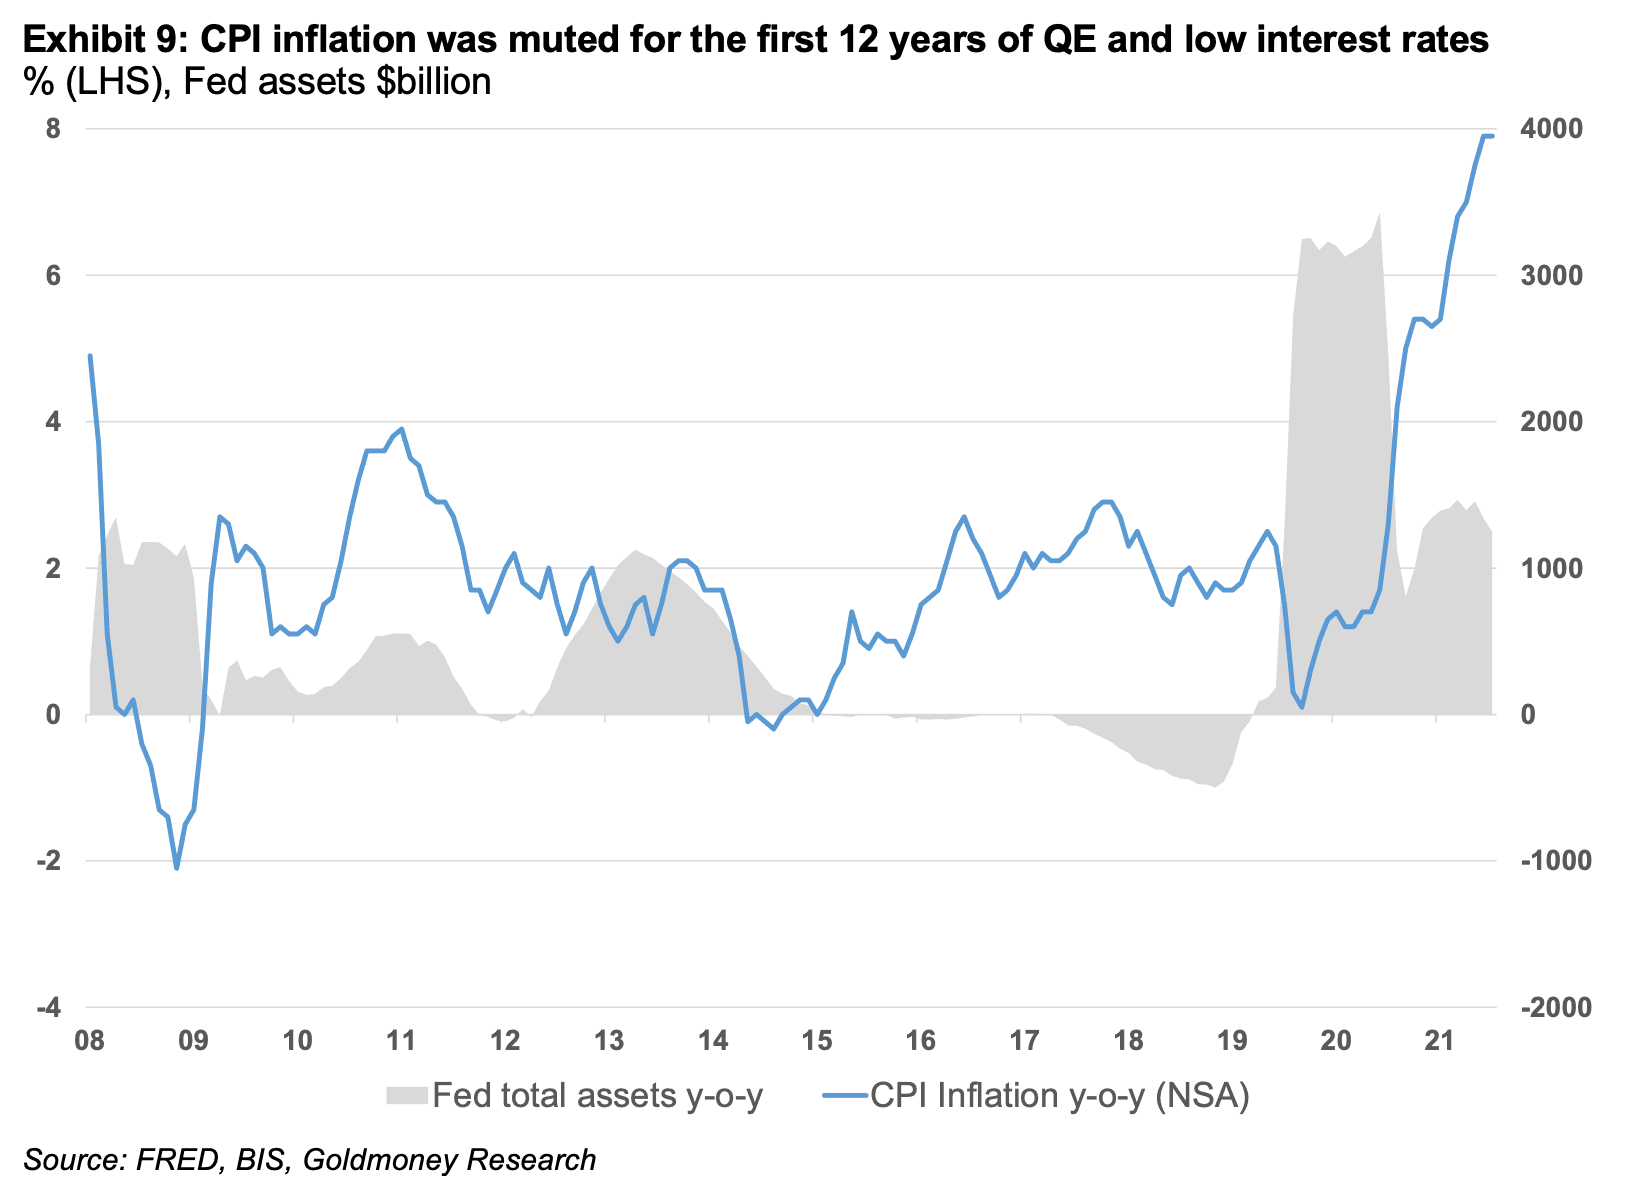 Let’s ignore for a second the flaws of the CPI as true measure for the cost of living. The main problem with the argument above is that we actually did see massive price inflation as a result of central bank asset buying, just not in the CPI. It is undeniable that prices of assets such as stocks, bonds and real estate have gone through an enormous inflationary period for more than ten years now. In our view, it was only a question of time when asset price inflation filters into the broader economy and we see broad based inflation picking up.
When prices for real estate explode, rents have to eventually adjust, especially in a rising rate environment. As rents for stores, warehouse etc. increase, those costs have to be passed onto the consumer. Prices of manufactured goods need to reflect increased land prices as it increases the costs to build new factories. In a similar fashion, exploding prices for arable land eventually lead to rising food prices. Once this process has started, it becomes self-perpetuating because higher prices for one good raises the costs for the manufacturing of other goods.
The result is a prolonged period of high inflation. We clearly see this in oil. One would expect that high oil prices give ample incentives for oil producers to increase production, but oil producers that could push output in the short term such as US shale oil producers, are facing rapidly rising costs. Fracking sand, fracking fluids and labor costs, among other things, are rising relentlessly.
Hence we think part of what we are seeing in longer-dated oil prices is really the result of the monetary policies that have persisted since the credit crisis in 2008. We believe that there will be a time when we have to pay the price for the monetary policies of the past 14 years, and we think that time has come now.
In our view, the Fed and other central banks are stuck between a rock and a hard place. In order to choke off inflation, they would have to sharply raise rates (to at least the rate of inflation) and quickly sell-back trillions of dollars’ worth of bonds. This would undoubtedly crash asset prices and trigger a steep global recession. Thus it is very unlikely that the Fed and other central banks will be able to unwind their balance sheets in any meaningful way, neither will they be able to raise interest rates to current inflation levels, much less to double digit levels. However, at the moment the Fed seems determined to keep on raising rates regardless, which in our view will be enough to stall the economy but it will not be enough to stop inflationary process that has been set in motion (maybe for brief period in the ensuing recession). The most likely result of all of this is stagflation. Thus, the cost of production for oil will keep rising rapidly for many years to come, effectively raisin the floor for long term oil prices.
Dire supply outlook for the coming decade
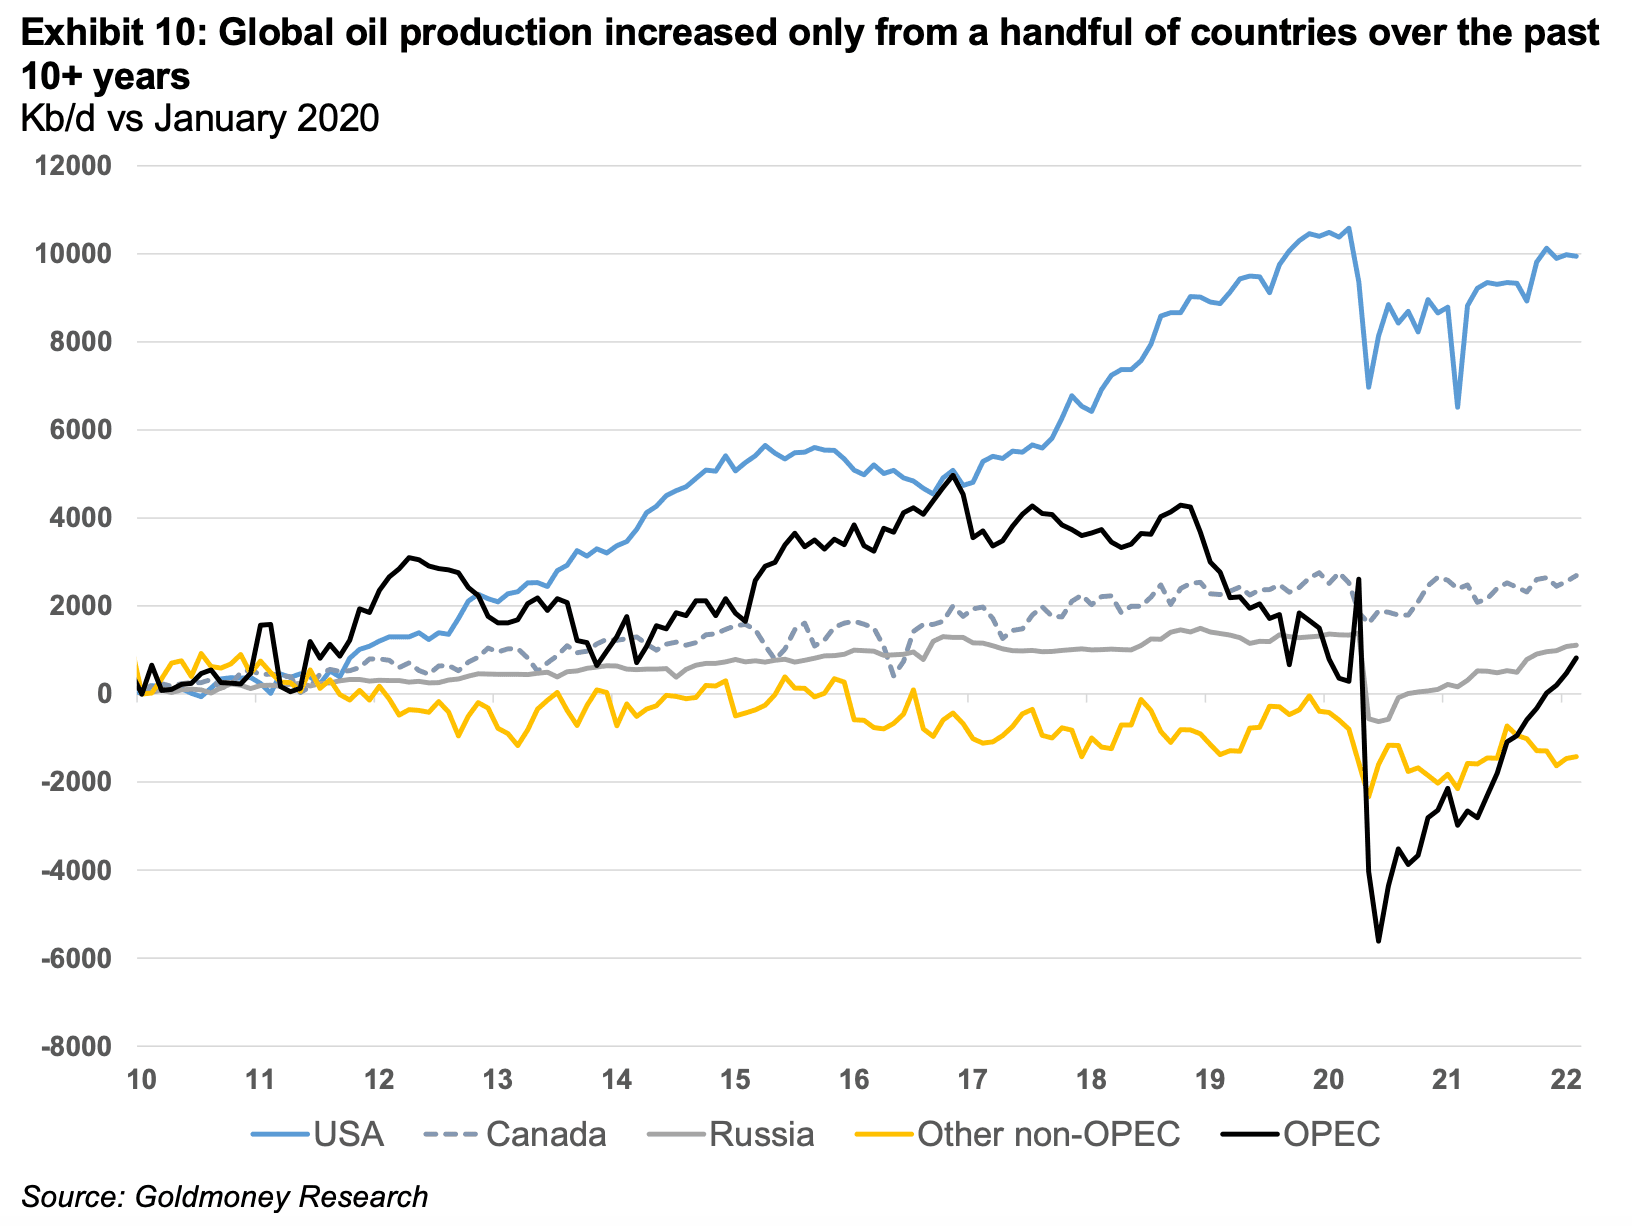
Unfortunately, cost inflation is not the only thing that is driving up the long term price of oil. The industry is also facing a massive problem with supply growth over the next decade. In order to understand how we got here, we have to take a step back. Supply growth over the past 10+ years came from three sources: OPEC, US shale oil and a handful of non-OPEC countries. The majority of non-OPEC production saw outright declines (see Exhibit 10).
OPEC added a substantial production capacity in the first half of the last decade, but since then production from non-core OPEC countries such as Iran, Venezuela, Angola, Nigeria and Libya is struggling. The reason why OPEC production was up at all over this time horizon is because Iraq and the three core OPEC members, Saudi Arabia, UAE and Kuwait, increased their output substantially. As for Iraq, this was the result of years of investments by international majors after the war that started in 2003. It took several years before those investments bore fruit, and it was not without overcoming substantial security issues. The core OPEC members Saudi Arabia, UAE and Kuwait relied mostly on ramping up existing capacity (but also invested substantially in order to maintain this capacity and by adding some new but highly complex new fields.
As we have outlined earlier in this report, the maximum capacity of the core OPEC members have likely been revealed in spring 2020. At the current pace, all of that spare capacity will be exhausted by 2H2022. We don’t expect this capacity to increase meaningfully going forward. OPEC countries – not unlike international oil companies - are facing the same long term uncertainties. The world is set to rapidly decarbonize over the next 20 years and oil demand will eventually peak as the transportation sector moves away from fossil fuels. But the lead times of new oil projects has increased substantially as they have become ever more complex and expensive. A new project can have a lead time of up to 10 years from the day it is sanctioned until the first barrel of oil flows. These projects also have life times of several decades. This means that oil projects sanctioned today, are destined to only become productive when global oil demand stagnates and eventually declines. Thus the core OPEC members have all slashed their CAPEX guidance for the coming years. The only wildcard within OPEC is Iran, where we could see a quick ramp up of 1mb/d should the country come to an agreement with the international community about their nuclear program. But we do not expect the same medium term growth in Iranian output as we have witnessed in Iraq.
US shale oil has been the largest single contributor to production growth over the past 10+ years. Output grew so much that it crashed prices in 2014. This was also when the long term prices sharply adjusted lower. For a while, the prevailing view in the oil market was that with oil prices around $50-65, US shale producers could meet any future supply needs. We always felt those expectations were misplaced. The shale oil industry was plagued with terrible negative returns for investors from the start. At $50-65, none of these businesses seemed viable long term. In addition, for the past 10+ years shale oil producers enjoyed abnormally low interest rates, thanks to fed policy depressing below-investment grade bond yields. With more normalized rates, shale oil profitability would look even worse. For the first 10 years of the shale oil revolution, producers were rewarded by the market for production growth at all costs. Thus for a while they received all the capital they needed to grow even as they destroyed most of that capital.
That has all changed now. US shale oil producers are now forced to focus on profits rather than growth. Production is growing again, but nowhere near the peak rates of >2mb/d (see Exhibit 2). Even with oil prices at >$100bbl, expectations are for US shale oil growth below 1mb/d y-o-y in 2022. And this outlook could be revised down rather than up in the coming months, as shale oil producers facing shortages of fracking sands, fracking fluids and labor and rising costs. The fact that this is a problem at these relatively modest production growth rates is concerning. Hence, US shale oil can no longer be consider the source of last resort. The new reality is that US production will grow at a much slower rate than the market had anticipated in the past.
Non-OPEC ex-US shale production has likely peaked in 2019 and will be in decline for the foreseeable future. In fact, if it wasn’t for the US, Russia and Canada, non-OPEC production had been declining since 2010. The recent events in Ukraine and the ensuing sanctions on Russia will greatly accelerate this process. At the moment, Russian output is curtailed due to voluntary sanctioning by Western companies. But going forward the Russian oil sector will struggle as it needs Western technology and investments. And despite the current crisis in energy markets and the persistent high prices, policy makers in the US seem to continue to be unwilling to allow new pipelines from Canada into the US, which would be needed to unlock more of the Canadian oil sands. In the meantime, declining production rates in the rest of the world will continue to accelerate and hardly any new projects are being sanctioned.
The combination of these factors means that global oil supply will struggle to meet continuously growing demand over the coming decade. At this point, it’s likely too late to incentivize conventional production. Despite the high prices, international oil majors continue to transform their businesses away from fossil fuels. This means that US shale producers would have to not just meet all future demand growth, but offset the decline in conventional production as well. This is very unlikely in our view and the only way to balance markets will be through demand destruction. This will require much higher prices than what is currently priced into the forward curve.
Longer dated prices have already begun to reflect this future environment. But at $75bbl long term price, the market is still way too optimistic about future supply. We think we are just at the beginning of a period of a multi-year readjustment of long-term oil prices.
[1] We recommend reading the first part of our two-part report Long term oil prices beginning to reflect the coming oil shortage – Part I, 28. March 2022 for an in-depth analysis of the strong correlation between inventories and the shape of the oil forward curve
The views and opinions expressed in this article are those of the author(s) and do not reflect those of Goldmoney, unless expressly stated. The article is for general information purposes only and does not constitute either Goldmoney or the author(s) providing you with legal, financial, tax, investment, or accounting advice. You should not act or rely on any information contained in the article without first seeking independent professional advice. Care has been taken to ensure that the information in the article is reliable; however, Goldmoney does not represent that it is accurate, complete, up-to-date and/or to be taken as an indication of future results and it should not be relied upon as such. Goldmoney will not be held responsible for any claim, loss, damage, or inconvenience caused as a result of any information or opinion contained in this article and any action taken as a result of the opinions and information contained in this article is at your own risk.
In the first part of this report (see Long term oil prices beginning to reflect the coming oil shortage – Part I, 28. March 2022) we explained in detail how we got to the current oil price shock (see Exhibit 1).
In a nutshell, after the oil crash in early 2020 on the back of the first global Covid19 lockdowns, OPEC+ members agreed on the largest production cuts in history. As global oil demand began to recover, OPEC+ decided to bring back supply slowly, leaving the market in deficit in order to bring elevated global inventories back to normal. However, for the past months, actual OPEC output is below the official target as many OPEC members are plagued with domestic issues that prevent full production.
Interestingly, the core OPEC members Saudi Arabia UAE and Kuwait are for once not stepping in to fill the gap. In our view, this may be partially politically driven due to some tensions between the US and some OPEC members, but more likely it is also due to their own capacity constraints. While Saudi Arabia and other core-OPEC members are still producing below their sustainable capacity, these countries can’t really step in and fill the production gaps left by the less stable OPEC producers, as it would mean they could not increase production anymore when they are supposed to, according to the OPEC+ roadmap. They have no choice then to stick to their own predetermined production path.
To make matters worse, US shale producers, once thought to be able to produce as much crude as needed, seem completely resilient to the latest price rally. After a decade of persistent losses in the pursuit of growth, the shale oil industry received clear warnings from banks, equity and bond markets. Thus for the past year, the US shale oil industry focused solely on profitability, which meant to stick to production guidance even as prices doubled. And they seem determined to not continue on this path in 2022. At $60/bbl expectations were that US shale companies grow production in 2022 by about 700-800kb/d. At $100/bbl, those expectations are still largely unchanged. It seems the days of >2mb/d production growth per year are gone forever (see Exhibit 2).
As a result, global demand continued to exceed production in 1Q22 at a time when in theory, we should have shifted to an oversupplied market. This meant that global oil inventories fell near their all-time lows relative to demand (see Exhibit 3) and the curve became extremely backwardated, meaning prompt prices trade at a large premium to deferred prices[1].
So it appears at first that the recent crude oil price spike was mainly the result of a curve being pushed into a steep backwardation (due to very low inventories) on the back of near-term supply issues. But that is not the whole picture. We think the more interesting story has been developing quietly at the long end of the curve. Longer-dated prices have broken out of their $50-65/bbl range they have been trading for the past seven years (see Exhibit 4). While short term price fluctuations are usually simply a function of fluctuating inventories, long term prices reflect the industry’s marginal cost of future supply.
Longer dated prices have been on a structural decline since the great recession in 2008 (see Exhibit 5). First it was the prospect of a prolonged period of low growth in the aftermath of the credit crisis that pushed longer dated prices lower. If demand was to grow at a slower pace because long-term global growth prospects looked dim, then the highest cost projects (such as Canadian oil sands, arctic oil and very complex oil projects) would no longer be needed, and the world could be entirely supplied with more conventional, cheaper oil projects. As a result, longer dated oil prices hovered around $100 for a few years (as opposed to $140/bbl at their peak in 2008). Just as those growth fears dissipated, the shale oil revolution changed the industry forever. A second oil crash happened from 2014-2015 which brought longer-dated prices even lower. At the end, the market began to price in that at $50-65, US shale oil producers could supply the world with all the oil it would ever need. However, since 2021 we are witnessing a break-out of longer-dated prices from this trading range.
So what is driving this? As we mentioned earlier in the report, the short end of the curve is driven by inventories. The long end of the curve is driven by marginal costs of future supply. So why is the market now suddenly pricing in that marginal costs of supply are rising? We think it is a mix of two things. On one hand the market begins to realize that current cost inflation for production is likely not a temporary phenomenon. On the other hand, it dawns to the market that we are going to face supply issues over the coming decade. In the remainder of this report we will take a deep dive into both of these drivers for marginal cost of future supply.
Production cost inflation unlikely to be just transitory
General inflation has been skyrocketing this year. US core price inflation (core excludes energy prices) is at a staggering 6.4%, CPI headline inflation is at 7.9% and Producer Price Inflation (PPI) for finished goods is at a whopping 13.8% (see Exhibit 6).
A lot has been written by economists and in the media about the source of this inflation over the past months. Some argue it’s simply due to supply chain disruptions on the back of worldwide Covid mandates and lockdowns that impacted raw material production, manufacturing and shipping. Some of that is likely true, and as mandates ease, the inflationary pressure from supply chain disruptions will somewhat abate, especially if we are heading into a recession. More important in our view is the phenomenon of excess spending on certain goods that occurred during the pandemic. The lockdown resulted in people having more disposable income and ordering goods online which they wouldn’t have otherwise (see Exhibit 7). This was exacerbated by various forms of Covid relief payments by governments across the world. It appears that people globally spent their money on similar product groups, lots of them manufactured in the Far East. This lead to manufactures struggling to keep up with demand and created shipping bottlenecks. As mandates will gradually be lifted, stimulus checks stop and normalcy returns, those goods flows will abate as well and inflationary pressures will disappear and potentially even reverse. Disposable income per capacity has largely normalized and has now fallen below trend (see Exhibit 7). In other words, inflation pressure from elevated disposable income is coming to an end. And as the Fed is raising rates to combat inflation just as excess spending is ending, this might be just what it takes to push the economy into recession.
Importantly, the inflation created by supply chain disruptions and stimulus driven demand are more important for short term inflation (and thus prompt oil prices) and not long tern inflation.
However, there is also the third driver for inflation which is impacting long term inflation expectations, and it’s not transitory in our view. Central banks have been de facto printing money at large scale since the great recession. The fed alone bought roughly 3.5 trillion in assets (mostly treasury bonds) between 2008-2014, also known as quantitative easing (QE). Most other major central banks had or still have similar polices. Only 10 years after it experimented with QE for the first time, the Fed ever dared to try unwinding that balance sheet, but after selling about $700 billion back between 2018 and 2019, turmoil in the repo market forced the Fed to take a hard turn and buy assets at a faster pace than ever before. By the end of 2019 (before Covid was a household name), the Fed was basically back to square one. Since then things have only gotten more extreme and currently there are $9tn of assets on the Feds balance sheet (see Exhibit 8). Other central banks have yet to show any attempt to unwind their balance sheets.
Many economists continue to argue that these assets purchases are not per se inflationary. They point to the lack of a spike in CPI inflation in the 10 years prior to the pandemic as evidence (see Exhibit 9).Let’s ignore for a second the flaws of the CPI as true measure for the cost of living. The main problem with the argument above is that we actually did see massive price inflation as a result of central bank asset buying, just not in the CPI. It is undeniable that prices of assets such as stocks, bonds and real estate have gone through an enormous inflationary period for more than ten years now. In our view, it was only a question of time when asset price inflation filters into the broader economy and we see broad based inflation picking up. When prices for real estate explode, rents have to eventually adjust, especially in a rising rate environment. As rents for stores, warehouse etc. increase, those costs have to be passed onto the consumer. Prices of manufactured goods need to reflect increased land prices as it increases the costs to build new factories. In a similar fashion, exploding prices for arable land eventually lead to rising food prices. Once this process has started, it becomes self-perpetuating because higher prices for one good raises the costs for the manufacturing of other goods.
The result is a prolonged period of high inflation. We clearly see this in oil. One would expect that high oil prices give ample incentives for oil producers to increase production, but oil producers that could push output in the short term such as US shale oil producers, are facing rapidly rising costs. Fracking sand, fracking fluids and labor costs, among other things, are rising relentlessly.
Hence we think part of what we are seeing in longer-dated oil prices is really the result of the monetary policies that have persisted since the credit crisis in 2008. We believe that there will be a time when we have to pay the price for the monetary policies of the past 14 years, and we think that time has come now.
In our view, the Fed and other central banks are stuck between a rock and a hard place. In order to choke off inflation, they would have to sharply raise rates (to at least the rate of inflation) and quickly sell-back trillions of dollars’ worth of bonds. This would undoubtedly crash asset prices and trigger a steep global recession. Thus it is very unlikely that the Fed and other central banks will be able to unwind their balance sheets in any meaningful way, neither will they be able to raise interest rates to current inflation levels, much less to double digit levels. However, at the moment the Fed seems determined to keep on raising rates regardless, which in our view will be enough to stall the economy but it will not be enough to stop inflationary process that has been set in motion (maybe for brief period in the ensuing recession). The most likely result of all of this is stagflation. Thus, the cost of production for oil will keep rising rapidly for many years to come, effectively raisin the floor for long term oil prices.
Dire supply outlook for the coming decade
Unfortunately, cost inflation is not the only thing that is driving up the long term price of oil. The industry is also facing a massive problem with supply growth over the next decade. In order to understand how we got here, we have to take a step back. Supply growth over the past 10+ years came from three sources: OPEC, US shale oil and a handful of non-OPEC countries. The majority of non-OPEC production saw outright declines (see Exhibit 10).
OPEC added a substantial production capacity in the first half of the last decade, but since then production from non-core OPEC countries such as Iran, Venezuela, Angola, Nigeria and Libya is struggling. The reason why OPEC production was up at all over this time horizon is because Iraq and the three core OPEC members, Saudi Arabia, UAE and Kuwait, increased their output substantially. As for Iraq, this was the result of years of investments by international majors after the war that started in 2003. It took several years before those investments bore fruit, and it was not without overcoming substantial security issues. The core OPEC members Saudi Arabia, UAE and Kuwait relied mostly on ramping up existing capacity (but also invested substantially in order to maintain this capacity and by adding some new but highly complex new fields.
As we have outlined earlier in this report, the maximum capacity of the core OPEC members have likely been revealed in spring 2020. At the current pace, all of that spare capacity will be exhausted by 2H2022. We don’t expect this capacity to increase meaningfully going forward. OPEC countries – not unlike international oil companies - are facing the same long term uncertainties. The world is set to rapidly decarbonize over the next 20 years and oil demand will eventually peak as the transportation sector moves away from fossil fuels. But the lead times of new oil projects has increased substantially as they have become ever more complex and expensive. A new project can have a lead time of up to 10 years from the day it is sanctioned until the first barrel of oil flows. These projects also have life times of several decades. This means that oil projects sanctioned today, are destined to only become productive when global oil demand stagnates and eventually declines. Thus the core OPEC members have all slashed their CAPEX guidance for the coming years. The only wildcard within OPEC is Iran, where we could see a quick ramp up of 1mb/d should the country come to an agreement with the international community about their nuclear program. But we do not expect the same medium term growth in Iranian output as we have witnessed in Iraq.
US shale oil has been the largest single contributor to production growth over the past 10+ years. Output grew so much that it crashed prices in 2014. This was also when the long term prices sharply adjusted lower. For a while, the prevailing view in the oil market was that with oil prices around $50-65, US shale producers could meet any future supply needs. We always felt those expectations were misplaced. The shale oil industry was plagued with terrible negative returns for investors from the start. At $50-65, none of these businesses seemed viable long term. In addition, for the past 10+ years shale oil producers enjoyed abnormally low interest rates, thanks to fed policy depressing below-investment grade bond yields. With more normalized rates, shale oil profitability would look even worse. For the first 10 years of the shale oil revolution, producers were rewarded by the market for production growth at all costs. Thus for a while they received all the capital they needed to grow even as they destroyed most of that capital.
That has all changed now. US shale oil producers are now forced to focus on profits rather than growth. Production is growing again, but nowhere near the peak rates of >2mb/d (see Exhibit 2). Even with oil prices at >$100bbl, expectations are for US shale oil growth below 1mb/d y-o-y in 2022. And this outlook could be revised down rather than up in the coming months, as shale oil producers facing shortages of fracking sands, fracking fluids and labor and rising costs. The fact that this is a problem at these relatively modest production growth rates is concerning. Hence, US shale oil can no longer be consider the source of last resort. The new reality is that US production will grow at a much slower rate than the market had anticipated in the past.
Non-OPEC ex-US shale production has likely peaked in 2019 and will be in decline for the foreseeable future. In fact, if it wasn’t for the US, Russia and Canada, non-OPEC production had been declining since 2010. The recent events in Ukraine and the ensuing sanctions on Russia will greatly accelerate this process. At the moment, Russian output is curtailed due to voluntary sanctioning by Western companies. But going forward the Russian oil sector will struggle as it needs Western technology and investments. And despite the current crisis in energy markets and the persistent high prices, policy makers in the US seem to continue to be unwilling to allow new pipelines from Canada into the US, which would be needed to unlock more of the Canadian oil sands. In the meantime, declining production rates in the rest of the world will continue to accelerate and hardly any new projects are being sanctioned.
The combination of these factors means that global oil supply will struggle to meet continuously growing demand over the coming decade. At this point, it’s likely too late to incentivize conventional production. Despite the high prices, international oil majors continue to transform their businesses away from fossil fuels. This means that US shale producers would have to not just meet all future demand growth, but offset the decline in conventional production as well. This is very unlikely in our view and the only way to balance markets will be through demand destruction. This will require much higher prices than what is currently priced into the forward curve.
Longer dated prices have already begun to reflect this future environment. But at $75bbl long term price, the market is still way too optimistic about future supply. We think we are just at the beginning of a period of a multi-year readjustment of long-term oil prices.
[1] We recommend reading the first part of our two-part report Long term oil prices beginning to reflect the coming oil shortage – Part I, 28. March 2022 for an in-depth analysis of the strong correlation between inventories and the shape of the oil forward curve
The views and opinions expressed in this article are those of the author(s) and do not reflect those of Goldmoney, unless expressly stated. The article is for general information purposes only and does not constitute either Goldmoney or the author(s) providing you with legal, financial, tax, investment, or accounting advice. You should not act or rely on any information contained in the article without first seeking independent professional advice. Care has been taken to ensure that the information in the article is reliable; however, Goldmoney does not represent that it is accurate, complete, up-to-date and/or to be taken as an indication of future results and it should not be relied upon as such. Goldmoney will not be held responsible for any claim, loss, damage, or inconvenience caused as a result of any information or opinion contained in this article and any action taken as a result of the opinions and information contained in this article is at your own risk.