The Path for Oil
Oct 10, 2017·Stefan WielerGlobal oil prices (Brent) continue to trade in a narrow USD45-55/bbl price range, reversing from a brief breakout to the upside last week. However, although prices are now back to where we started at the beginning of the year, the underlying fundamentals have changed dramatically. After years of surpluses, the global oil market finally flipped into a deficit in 3Q17. Meanwhile the market remains focused on apparently rapid US production growth even though the US DOE keeps revising these numbers down dramatically month after month. We expect the global deficit to increase meaningfully in 4Q17, leading to sharp draws in petroleum inventories and pushing Brent prices towards USD60/bbl.
View the Entire Research Piece as a PDF here.
Last week oil finally broke out of its narrow trading range of USD45-55/bbl (Brent) it has been trading in since mid-2016. The final push over USD55/bbl last week was driven mainly by concerns over Turkey President Erdogan threatening to shut down an oil pipeline bringing crude from the Kurdish controlled region in Iraq, should the Kurds vote for independence.
However, the rally was short lived and oil prices moved sharply lower again as it became clear that, despite the rhetoric, the oil kept flowing, at least for now. This pushed prices back to USD55/bbl at the time of writing, the same levels as at the beginning of the year. However, what the market seems to be missing is that the oil balance is fundamentally different from the beginning of the year. More specifically, over the past few months we have witnessed a global oil market shifting from years of surplus into deficit.
Global petroleum inventories have been building since 2014 on the back of relentless growth in US crude oil production. Initially OPEC decided to let things play out. They were reluctant to cut back output to accommodate US production growth, knowing that over the long run that would be a losing strategy as it would simply cost OPEC market share while the pressure on prices would remain. As a result, prices collapsed in the second half of 2014 and inventories began to build rapidly. The price decline eventually led to sharp cuts in CAPEX among US producers and US oil output began to contract in 2015. From that point global Inventories no longer built at the same speed, yet the market remained in a slight surplus. OECD inventories stopped building altogether but stocks remained at elevated levels. In order to speed up the inventory normalization process, OPEC decided in late 2016 to curtail production nevertheless. While initially this led to some price recovery, oil prices soon began to decline again as the market believed that the OPEC cuts were insufficient to bring down inventories meaningfully.
However, the more data we receive, the more obvious it becomes that inventories, particularly in the West, have been in a seasonal deficit for months now. While in the first quarter of 2017, the global oil market was still in surplus and global inventories were building (faster than the seasonal trend), this seasonal surplus shifted to a seasonally balanced market in 2Q17 and by 3Q17 we were in a seasonal deficit (see Figure 1).
More importantly, even as global inventories were building earlier this year, most of this occurred in non-OECD countries (Chinas SPR absorbed a lot of the surplus) while inventories in the OECD countries have been in a seasonally adjusted deficit for many months now (see Figure 2). In the US, the draws in total petroleum stocks was particularly impressive as we have been writing for some weeks.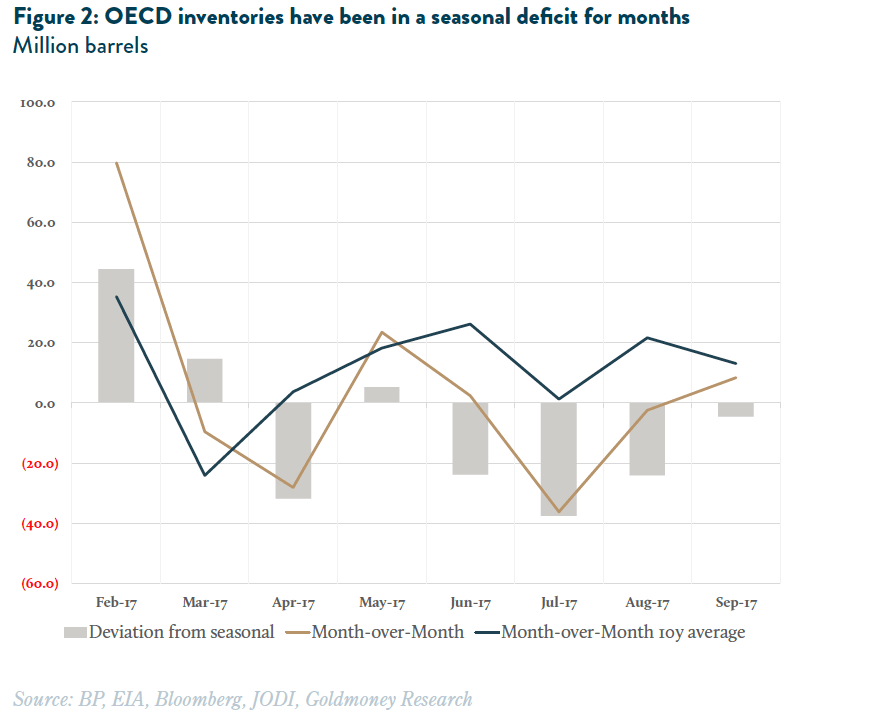
The market so far has largely ignored this trend as it seems to be more focused on growing US production. The weekly petroleum status report published by the US Department of Energy (DOE) every Wednesday suggests that US production growth went from negative year-over-year at the beginning of this year to over 1mb/d as of now. This would, so the argument goes, soon put an end to the inventory normalization.
However, as we have pointed out before, the weekly DOE petroleum report has been overstating US production growth for months. This is mainly due to two reasons. First, there is a base effect. Production growth looks so impressive because the DOE had reported a sharp decline in US production in summer 2016 in the weekly data. However, the more accurate monthly data (according to the DOE the monthly data is not a revision of the weekly, it is simply a different and more accurate dataset) shows that this decline was heavily overstated (leading to an understated production figure). Understating production in one year will lead to an overstated year-over-year production growth figure for the same period the following year (see Figure 3) which is what we are seeing now.
Second, similar to how the weekly data understated production last year, it is overstating production this year. More specifically, in the weekly production data, US output rose to 9.4mb/d by July 2017. However, the monthly data shows that production only reached 9.2mb/d. Putting all these numbers together, year-over-year production growth in 2Q2017 was only 303kb/d and not 527kb/d as reported in the weekly data, a delta of 224kb/d. This divergence grew to a whopping 377kb/d in July (monthly production growth of 556kb/d vs weekly 993kb/d).
This poses some severe doubts over the 1mb/d year-over-year production growth figures for August and September as reported in the weekly data. We believe that the weekly data for August and September will be revised down sharply once the monthly data comes out. If the revisions of the past three months are any indication, true output was likely flat over the past two months (up 600kb/d year-over-year). But if the revisions are as large as the one for July, production has actually declined over the past two months. In a nutshell, contrary to what the market currently seems to believe, US shale production is unlikely to grow at 1mb/d year-over year in a USD50/bbl price environment.
This puts some serious doubts about production forecasts for 2018. Both the US Energy Information Administration (EIA) and the International Energy Agency (IEA) have already revised down their production forecasts in recent months. But both agencies are still expecting an acceleration in US production growth:
- The EIA forecasts in their latest short-term energy outlook (STEO) from September 12 that US crude oil output will average 9.8 million b/d, the highest level on record and an increase of 0.6mb/d year-over-year. This only reflects crude oil production, NGLs are separate and are also expected to grow by about 0.5mb/d
- The IEA forecasts in their September report that US crude production will be growing by 850 thousand b/d year-over year in 2018. On top of that, the agency expects NGLs to grow by 260 thousand b/d.
Consequently, while the composition varies, both agencies forecast US liquids production growth of 1.1mb/d. We believe that the recent production data indicates that these numbers are most likely too high in the current price environment and thus that US liquids output growth will be 0.9mb/d at most, unless US crude prices move substantially higher.
OPEC
The global oil inventory path will also depend on what OPEC decides over the next few months as the current production cut agreement is about to expire in March 2018. Based on statements over the past few days by officials from several OPEC members states, we believe that the agreed cuts will most likely be at least extended until the end of 2018. The next OPEC meeting is on November 30, 2017.
THE OUTLOOK
Applying these forecasts to our global oil balance, we currently forecast global supply to grow by 0.2mb/d year-over year in 4Q2017 and 1.2mb/d in 2018. Demand is forecasted to grow by 1mb/d and 1.35mb/d, respectively. This will lead to a seasonallyadjusted deficit of 0.8mb/d in 4Q2017 and 0.1mb/d in 2018. As we expect non-OECD inventories to continue to build, the declines will occur in OECD stocks, amplified by the continued builds in non-OECD inventories. However, some of that OECD deficit will be offset by continued releases from US strategic petroleum reserves, reducing the draw on industry stocks (see table 1). As inventories decline, we expect continued strength in time-spreads which will push spot prices higher. Our target for early 2018 is USD60/bbl for Brent. We also expect the Brent-WTI differential to narrow significantly going forward to around USD2-3/bbl which means that WTI prices have more upside than Brent.
The views and opinions expressed in this article are those of the author(s) and do not reflect those of Goldmoney, unless expressly stated. The article is for general information purposes only and does not constitute either Goldmoney or the author(s) providing you with legal, financial, tax, investment, or accounting advice. You should not act or rely on any information contained in the article without first seeking independent professional advice. Care has been taken to ensure that the information in the article is reliable; however, Goldmoney does not represent that it is accurate, complete, up-to-date and/or to be taken as an indication of future results and it should not be relied upon as such. Goldmoney will not be held responsible for any claim, loss, damage, or inconvenience caused as a result of any information or opinion contained in this article and any action taken as a result of the opinions and information contained in this article is at your own risk.