The coming oil shortage – Part II
Apr 23, 2021·Goldmoney InsightsThe oil price crash on the back of the COVID-19 lockdowns has accelerated the coming supply crunch. Both national and international oil companies have slashed CAPEX and maintenance spending, which will accelerate decline rates and US shale drillers finally focus on profitability instead of growth. Current longer-dated oil prices are too low to give enough incentive to oil companies to invest in badly needed future oil production. When they finally rise, gold prices will be pushed sharply higher.
In the first part of this report (The coming oil shortage – Part I, 20 April 2021), we discussed the impact of longer-dated energy prices on gold. We outlined how production from OPEC+, US shale oil producers and non-OPEC (ex US shale) collapsed on the back of the lockdown induced price crash. In this report we take a close look at these three sources of oil supply and how we expect production to develop as the world recovers from the pandemic.
OPEC+:
OPEC+ production is down because OPEC decided to do so. Production costs for most OPEC producers tends to be very low. Saudi Arabia for example, didn’t need to shut in production because it became uneconomical. They shut in because they didn’t want prices to decline even further. But had global prices declined even further, Saudi, and other core OEPC members, would have been the last ones to see prices drop below their operating costs. Importantly for the future, this production can be turned back on the same way it was shut off, as there hasn’t been any meaningful impact on capacity.
However, that doesn’t mean that the COVID-19 pandemic had no impact on the long term prospects of OPEC oil production. Much like their non-OPEC counterparts, OPEC producers drastically slashed their CAPEX. For example, when Saudi Aramco had its IPO in 2019, the company stated in the IPO prospectus that it plans to spend between $35-40bn in CAPEX in 2020. By March 2020 it had lowered that to $25-30bn. But even as oil prices sharply recovered, Aramco kept revising CAPEX guidance lower. In March 2021 it revised its FY CAPEX target to $35bn from previously $40-45bn, and Aramco is still among the higher spenders among the OPEC countries. ADNOC (Abu Dhabi National Oil Company) revised its 2020 CAPEX down 35%. And while in December last year it celebrated a 5-year spending plan (2021-2025) of $122bn, this was $10bn lower than the previous 5-year plan. KPC (Kuwait Petroleum Corp) announced in March last year that would sharply cut its CAPEX for 2020. The company then announced in August 2020 that it would cut its 5-year spending plan by a whopping 25% by cancelling some projects and postponing others, including exploration.
Less is known about the CAPEX plans of the national oil companies in non-core OPEC nations, but given that they are in much more dire financial situations than Saudi Arabia, the UAE and Kuwait, it’s reasonable to assume that spending cuts will be relatively larger compared to the core members. And while the core OPEC nations rely on their own national oil companies, most non-core members rely on international oil companies to run existing and develop new fields. Many of these companies have drastically reduced their CAPEX outlook (we discuss this further below), including their spending in OPEC countries. Industry consultant Wood Mackenzie estimated last year that international oil companies would cut their spending plans for the African continent by 33%. Seven out of 15 OPEC members are African Nations.
Reduction in CAPEX spending is not the only way future oil output will be impacted. Oil companies drastically reduced operational spending (maintenance) as well. This has a more immediate impact on output than CAPEX cuts. The problem is that reduced operational spending often leads to a permanent capacity impairment. In other words, while voluntary production cuts per see are not necessarily problematic as it just creates spare capacity that can be tapped later when demand returns, reduced maintenance spending can have a permanent impact on a well and production may never return to previous levels. WoodMac estimated last year that some companies operating in Africa cut operational spending by as much as 40%.
On net, while we think that OPEC+ will be able to rapidly fill the supply gap near term with spare capacity when demand returns in 2H21 as normalcy returns. However, the world won’t be able to rely on new OPEC supply medium to long term to meet growing demand. In fact, we think the natural decline of some OPEC members will accelerate going forward. This is a sharp departure from the previous 10 years, where OPEC added 5mb/d of production to meet growing demand. Much of this production was new capacity rather than spare capacity.
Exhibit 9: Since 2010, OPEC added 5mb/d of supply to meet growing demand
Kb/d, OPEC (ex Libya and Iran)

Source: Goldmoney Research
Non-OPEC ex US shale:
Prior to the COVID-19 outbreak, we had argued that 2020 would be the last year of positive non-OPEC ex US shale production growth. Production was expected to grow as projects that had been sanctioned many years ago would finally come online. However, a rapidly depleting project pipeline combined with accelerating natural decline rates would mean that from 2021 onwards, non-OPEC ex US shale would decline in the foreseeable future.
The price crash in 2020 resulted in a production decline already in 2020, as some producers came close to cash costs. Many producers reduced maintenance in their fields, something we had witnessed already in 2008-2009. However, this is a short term effect. The more important effect is that non-OPEC producers massively slashed their CAPEX. Exxon slashed 30% of their 2020 spending and then a further 11-25% in 2020. BP cut their 2020 capital spending by 25%. The company also announced in March 2021 that it would exit its Kazakh oil projects – an important driver of future growth - and would focus on renewables. BP seeks to reduce its hydrocarbon business by 40% over the next ten years. Shell and total cut their 2020 CAPEX by 20% and announced to transform to a greener business, with Shell aiming to become a net-zero energy business by 2050. While some of these divestitures simply mean that existing assets change from a large oil company to another one, it also means that the companies selling their assets will not invest in new projects.
This means, the already dry project pipeline will deplete even faster. This has partially to do with the price shock. But it has equally to do with the realignment of global oil companies towards a greener economy. Many oil and gas majors have announced that they are aiming to invest in renewable energy at the expense of their traditional business. In the past, such announcement were merely more than public relations efforts, but the COVID-19 crisis has probably accelerated the push towards de-carbonization of the economy as well. We expect governments around the world to push for major infrastructure bills in the coming months with a clear focus on “a green new deal”. At the same time, carbon pricing is going global. Energy giants facing the tough decision whether to invest billions of dollars into fossil fuel projects with lead times often exceeding 10 years and lifetimes of 30+ years. Even though these projects may ultimately turn out to be very profitable, they come with a huge amount of uncertainty tied to the future of fossil fuels. This uncertainty problem is not new and has forced oil majors into the shale sector over the past years, as the lead time is much shorter. But with the current outlook, oil companies are probably not just thinking twice but three times to sanction one of those gigantic oil projects.
As result, we think that non-OPEC ex US shale production has likely peaked and will slowly decline from here onwards. Substantially higher prices (on the back end of the curve) will be needed to incentivize oil companies to make the necessary investments, and even if those investments are made, it will take many years for that production to become operational.
Exhibit 10: Non-OPEC ex US shale production is expected to decline in the coming years
Kb/d year-over-year
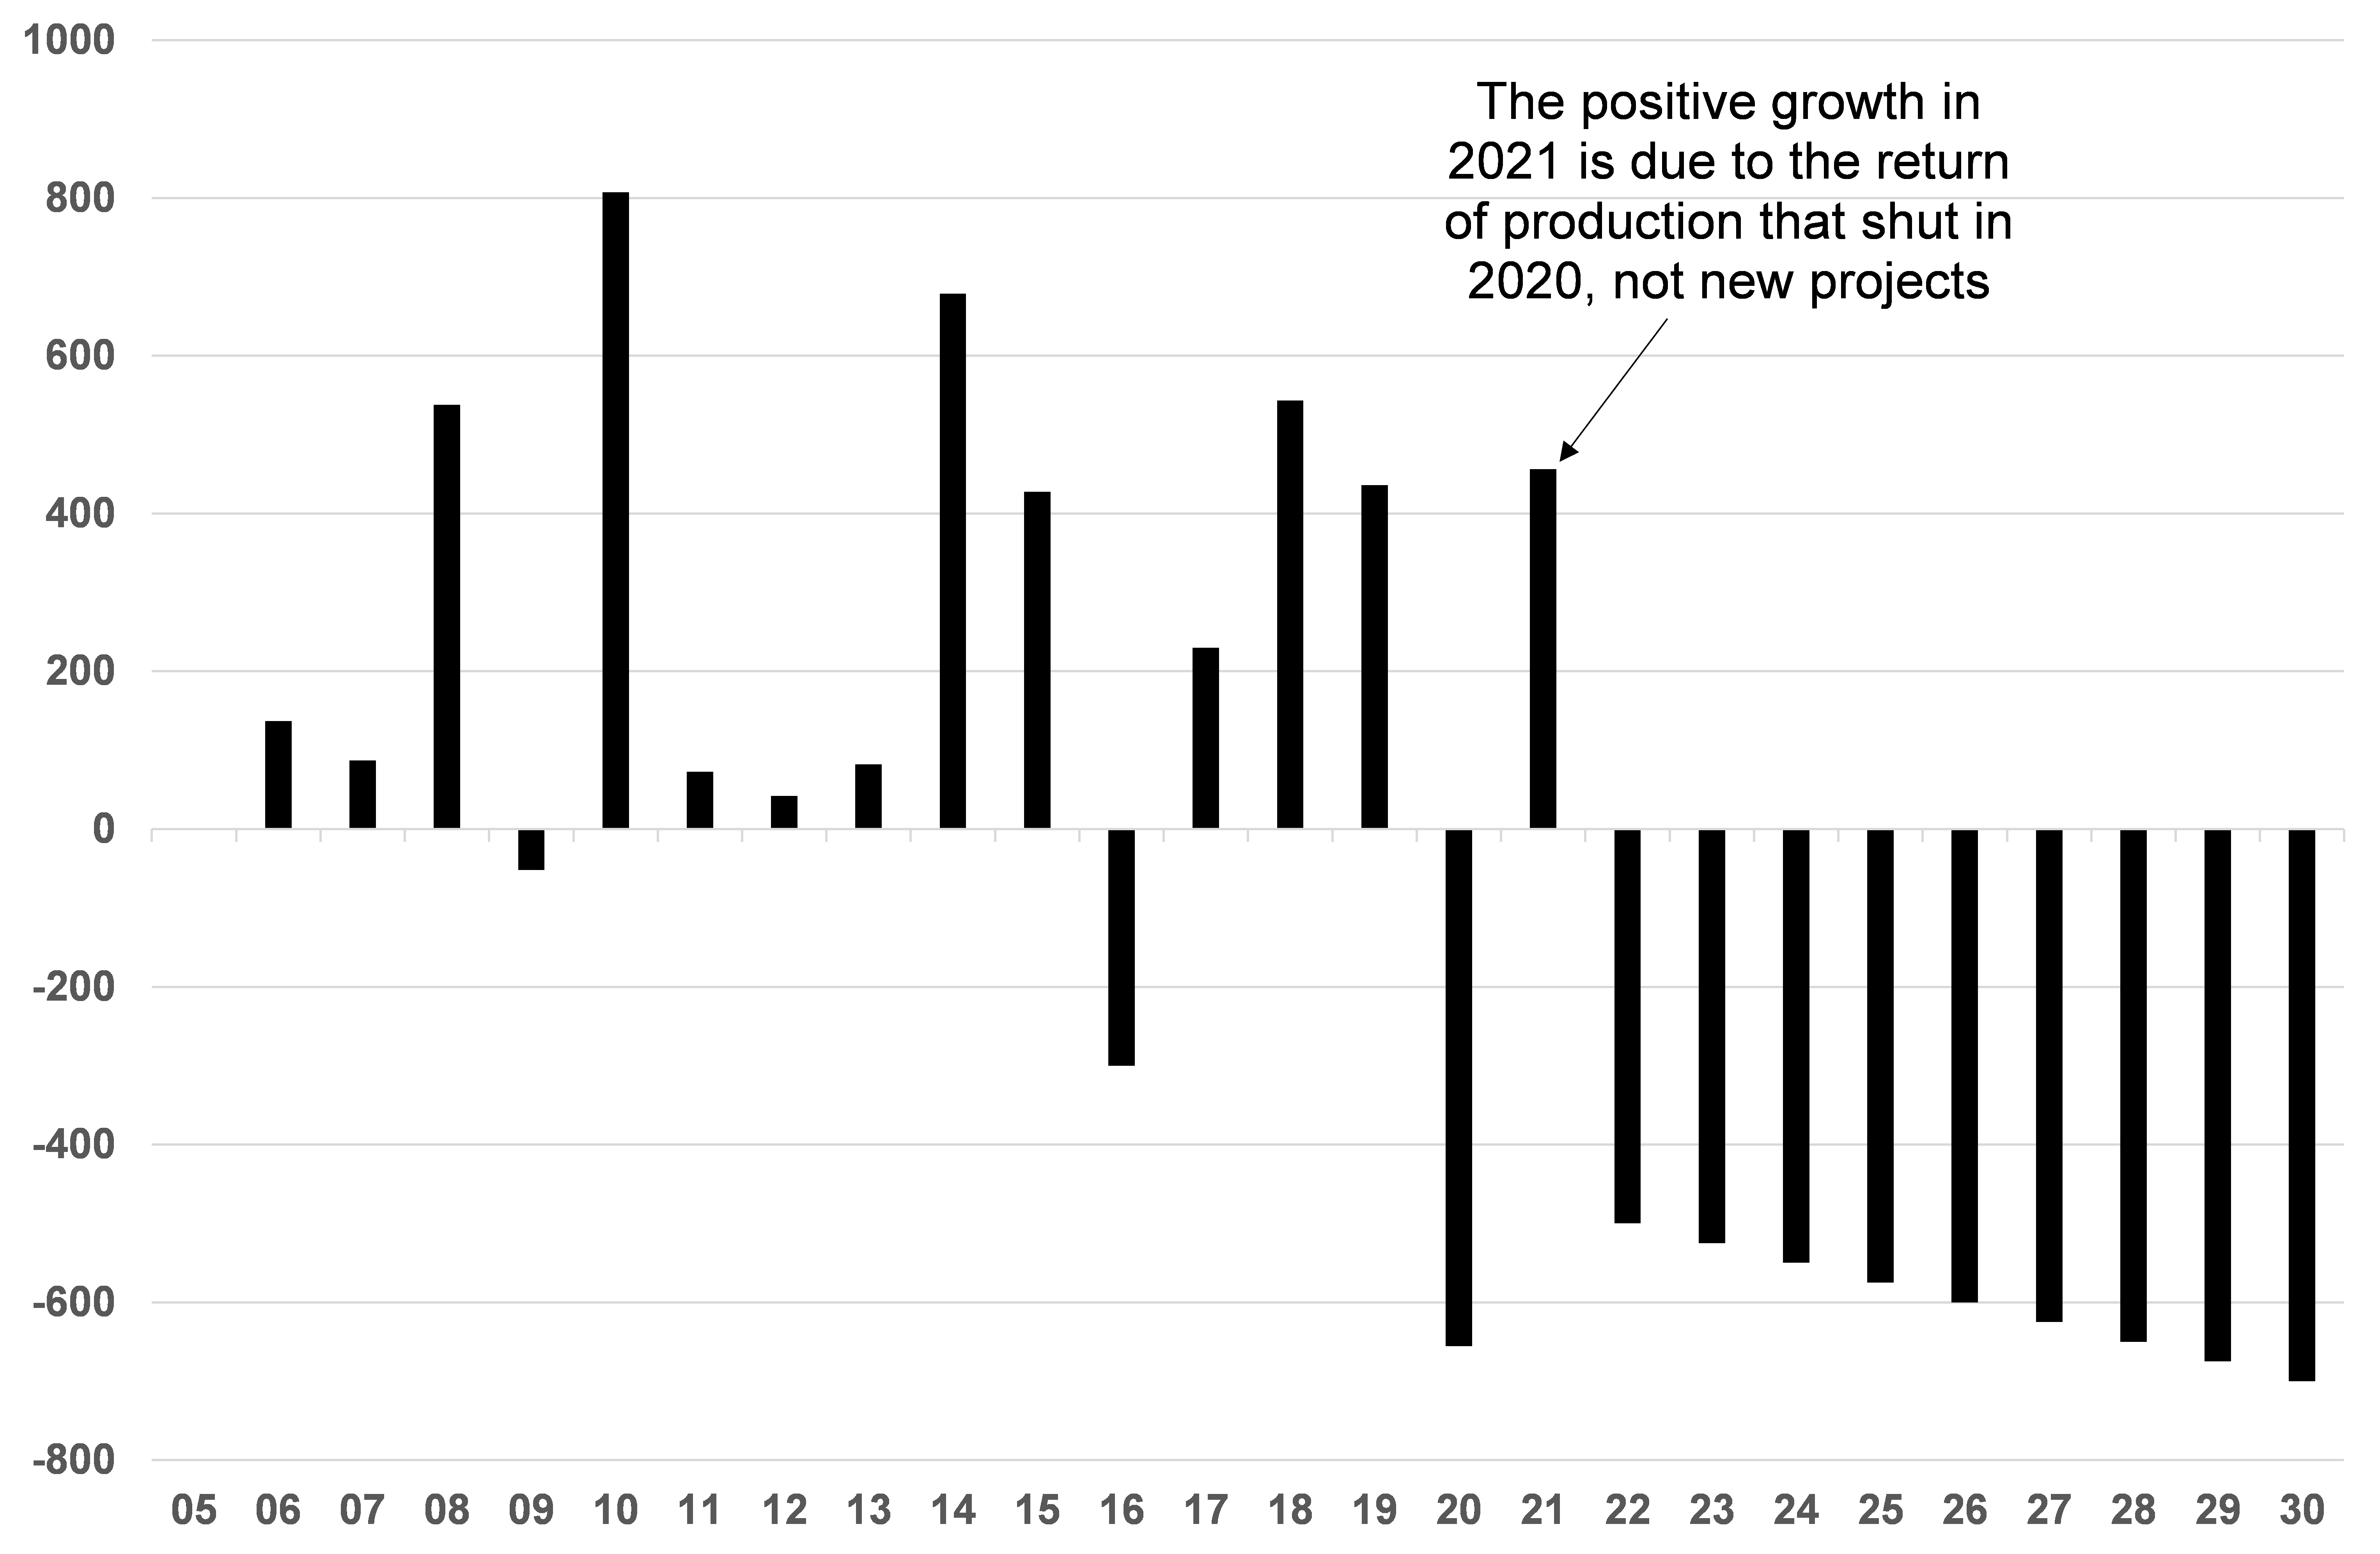
Source: Goldmoney Research
US shale oil:
US shale oil producers shut in production because it became hugely. A large part of US production even saw negative prices. But even as prices recovered quickly to $40/bbl, hardly any producer could cover their operating costs, let alone being profitable. This lead to a continuous decline in output and only very recently we saw a modest recovery in production. At this point, production is down around 2.5mb/d from peak.
One might argue that we have seen the same dynamics before. Back in 2014, US shale oil production was also growing at breakneck pace. This eventually led to a much oversupplied global market and a price crash from $110/bbl to $30/bbl over 18 months. As a consequence, US shale oil production also sharply declined, which eventually rebalanced the market. Prices recovered and stabilized at around $60-70/bbl. Subsequently US shale producers slowly adapted to the new price environment and by 2019, production again grew at over 2mb/d. But in 2019, the market had not much trouble absorbing that kind of production. In fact, it depended on it.
However, the recent price crash and ensuing production decline doesn’t seem to follow the same path. Oil prices have fully recovered by now, but production has not. In fact, US production is near the lowest it has been since the outbreak of the pandemic. Moreover, drilling activity is also greatly lagging. Arguably the US oil rig count has recovered from 172 in August 2020 to currently 344, but this seems not enough to keep production even constant.
Exhibit 11: US production has yet to show any meaningful recovery despite the full price recovery
Kb/d year-over-year
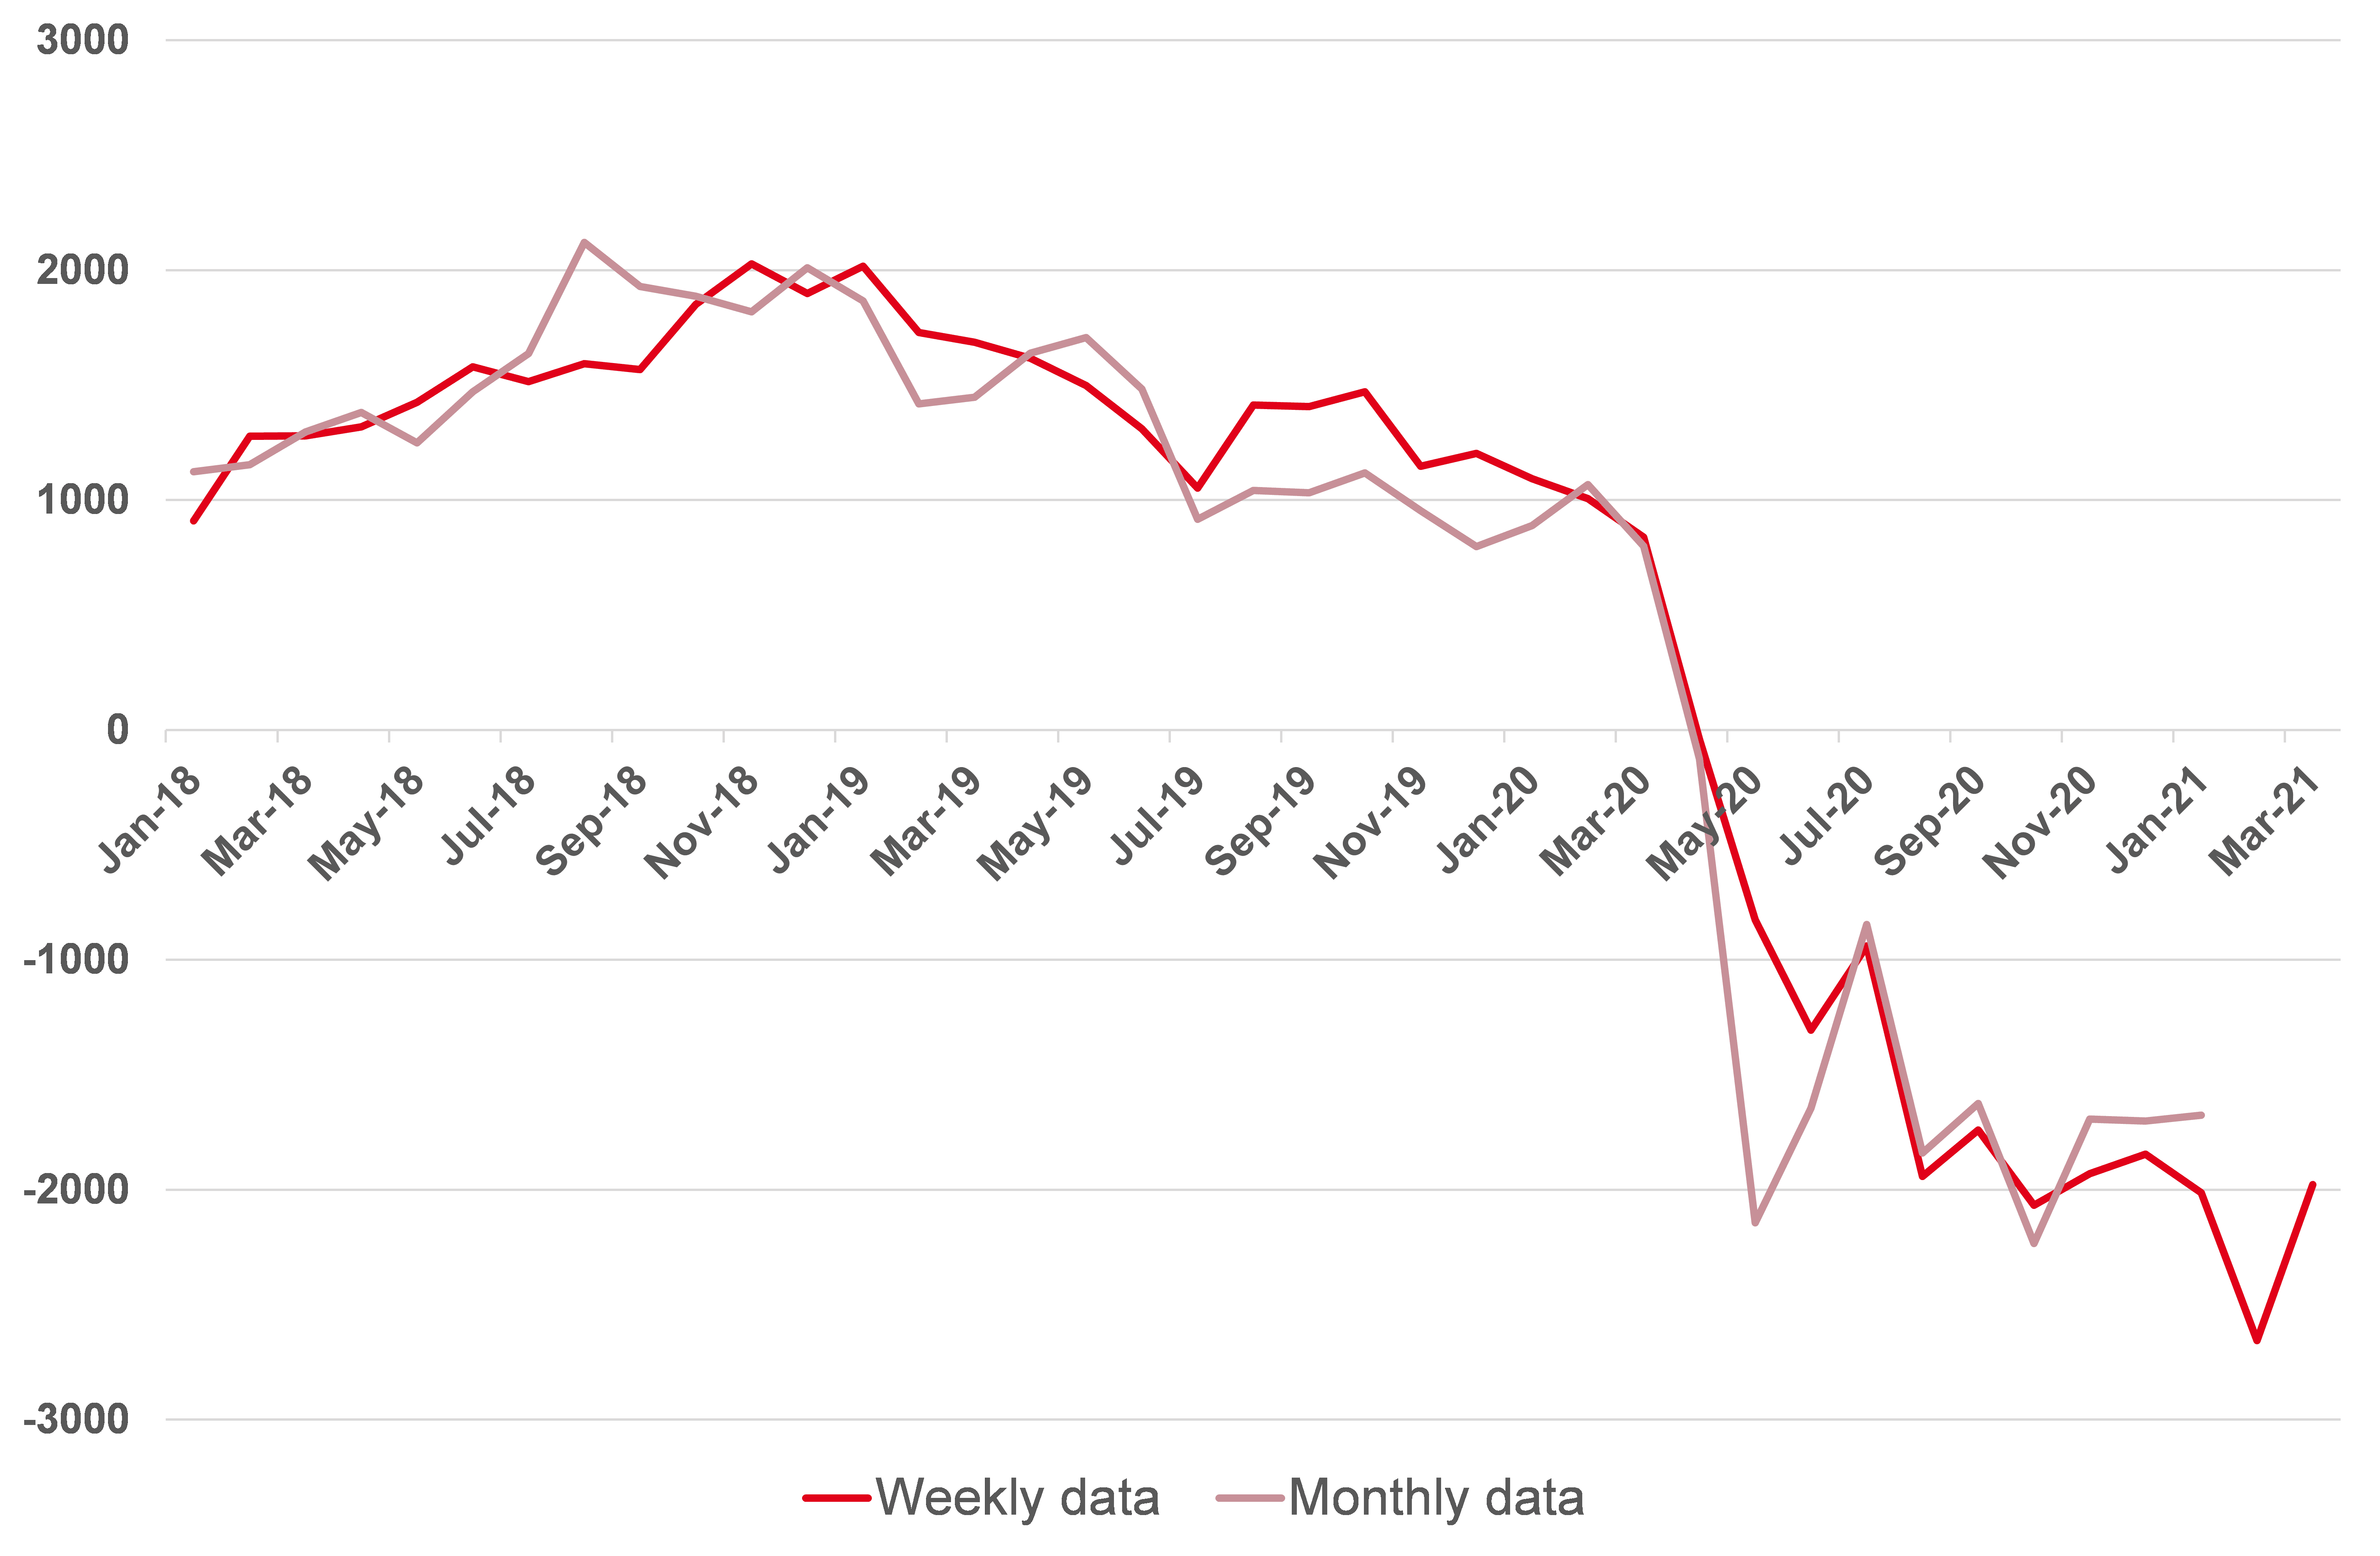
Source: EIA. Goldmoney Research
In fact, the reason why US shale output is not lower despite this very low rig count is because producers reverted to high grading. High grading means the producers are producing from their most prolific acreage. This also means that any production increase would require a massive redeployment of rigs as new wells would be less prolific than the current ones. But US producers vowed to their investors as well as to their banks that – unlike the last time prices recovered – they would refrain from growing output and focus on profitability instead.
Exhibit 12: As the rig count fell, average production per rig increased due to high grading
B/d and rig count (Permian Basin)
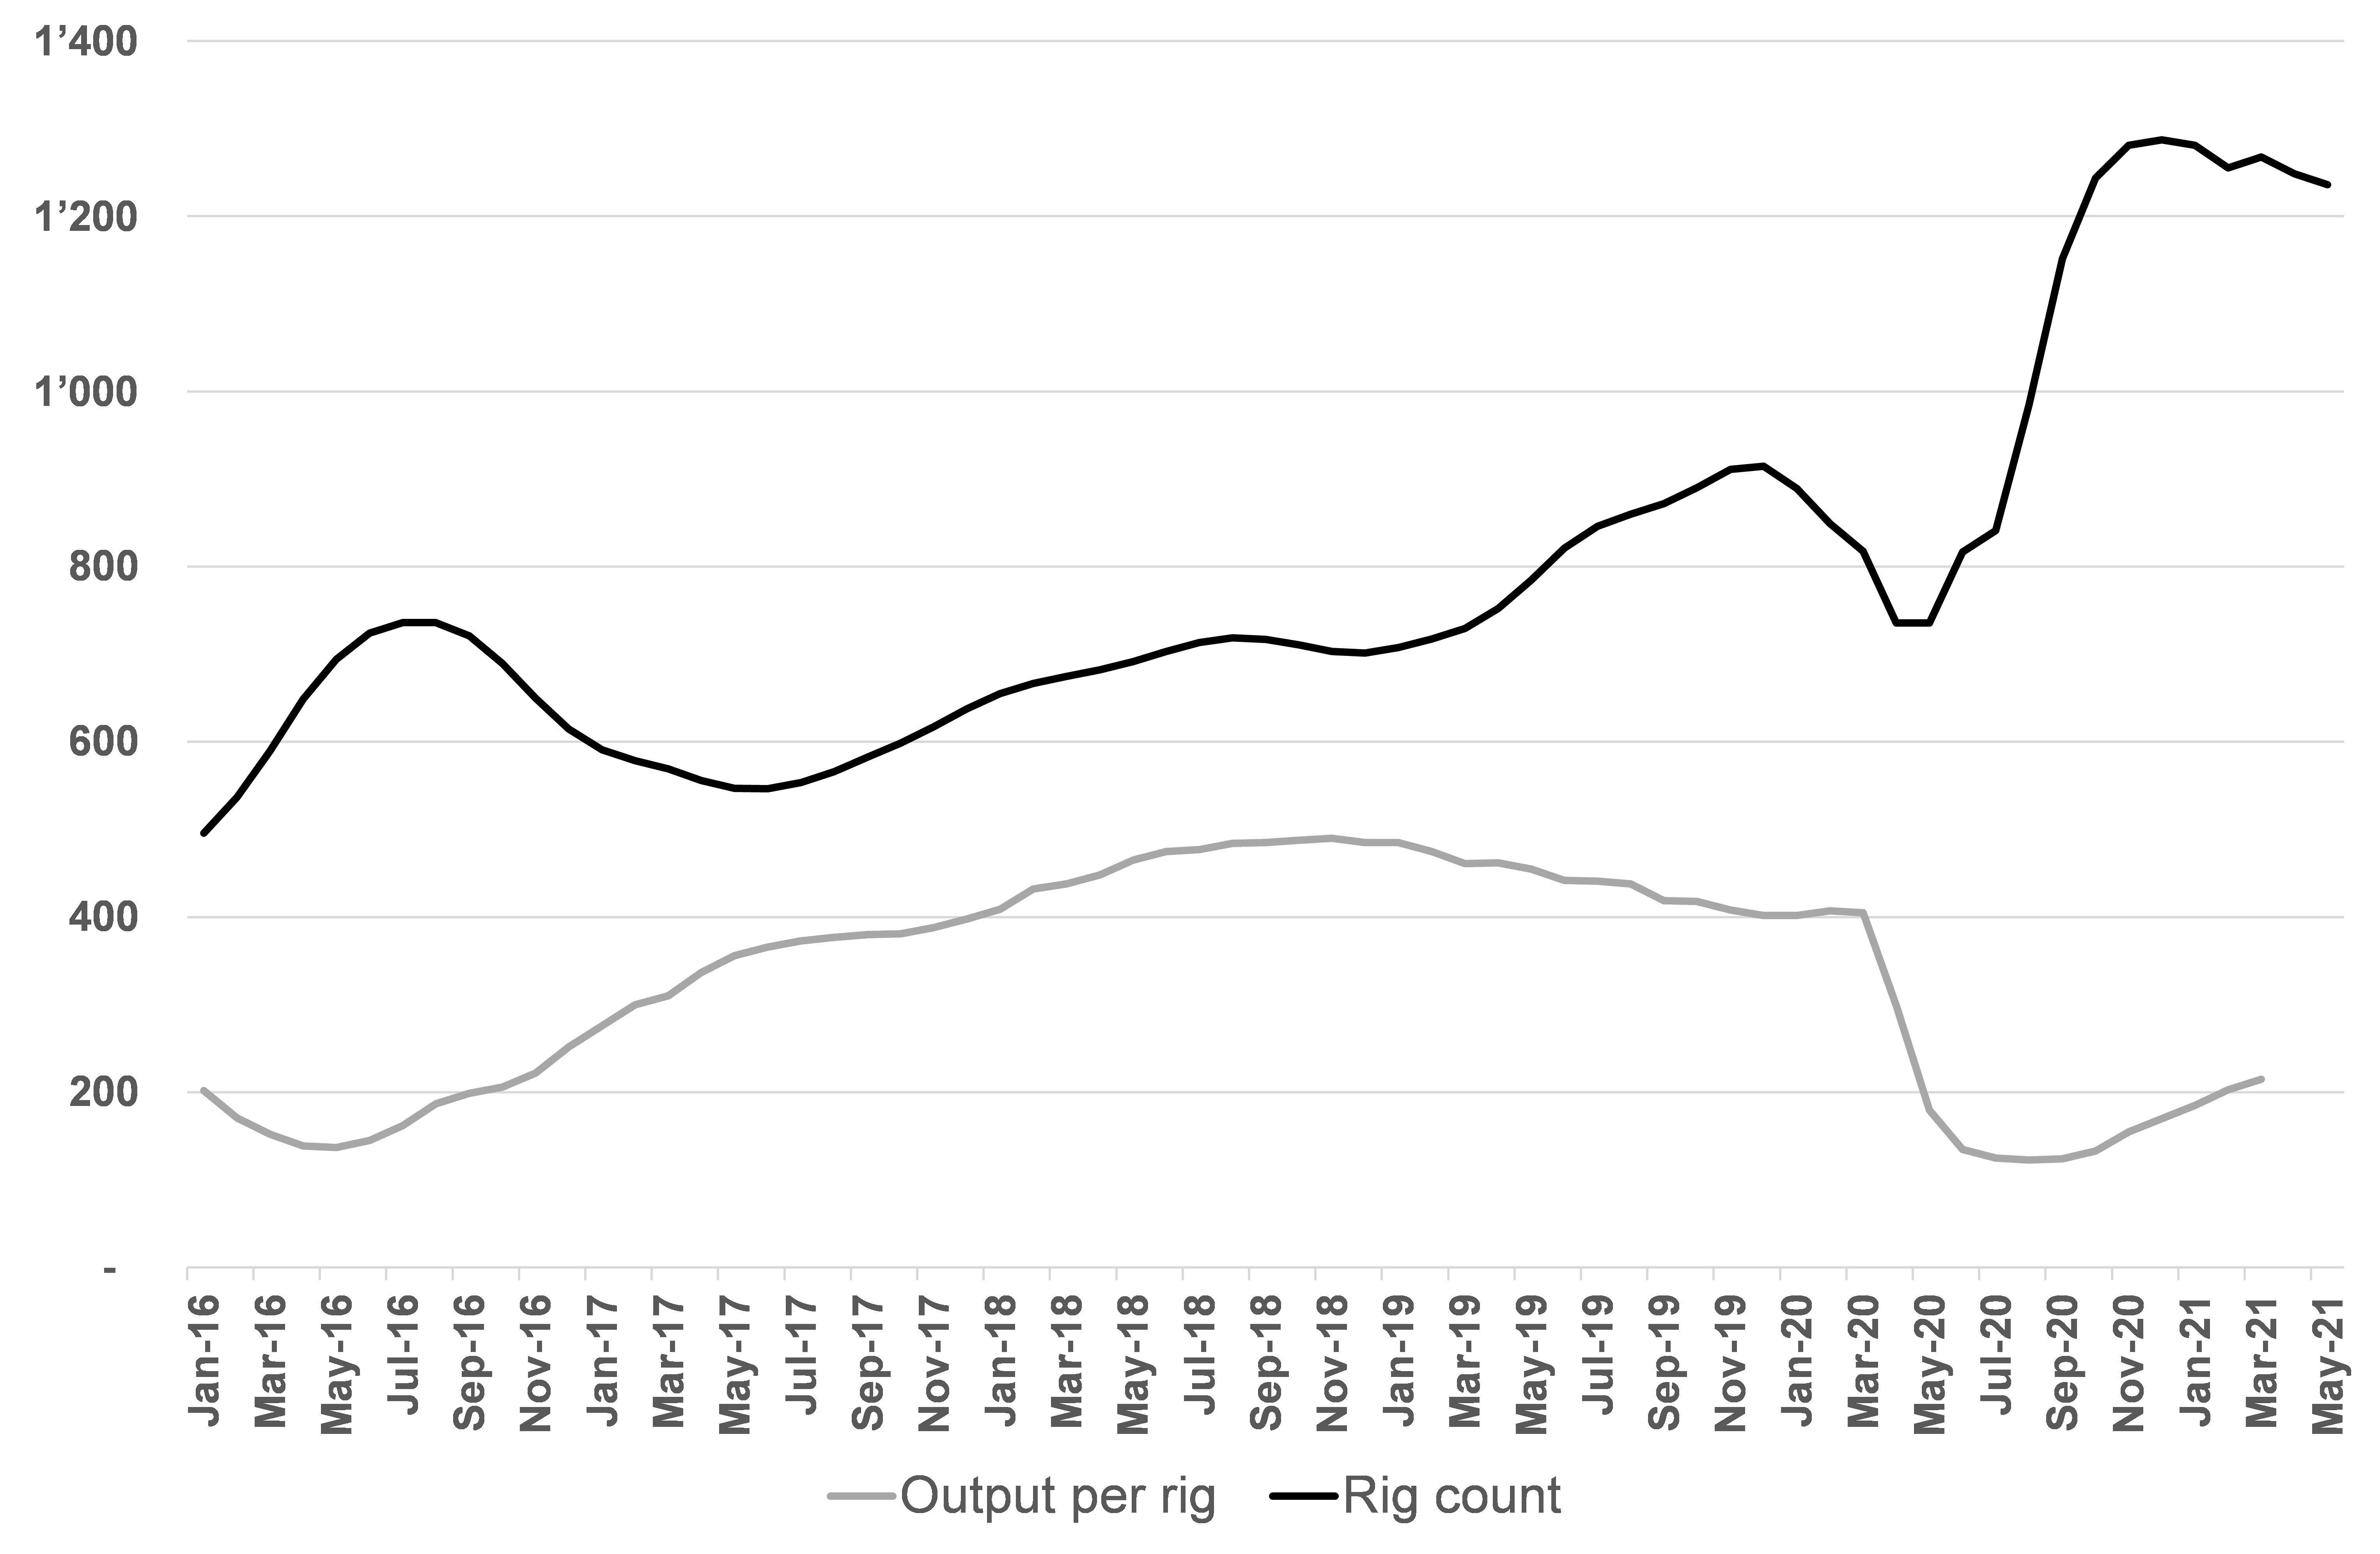
Source: EIA, Goldmoney Research
A further issue is the size of US shale output and the steep decline rates. Unlike shale gas producers which somehow managed to flatten their decline curves, shale oil producers still struggling with decline rates around 70% in the first year. The larger total US shale oil output gets, the more new production has to be brought online to simply offset the decline rates in existing output. This is not a new problem, but the recent reluctance of US producers to grow output at all costs means this issue is now real.
Exhibit 13: Steep decline rates remain a problem as US shale oil output remains high even after the crash
B/d all basins

Source: EIA, Goldmoney Research
The pandemic and the price crash have also accelerated phenomenon that was already known from the shale gas market, but is new to the shale oil market. In the US, there used to be multiple shale oil basins which all showed production growth, albeit at different speeds. The Permian basin became sort of the king of shale oil, but other basins such as the Bakken (the first), Eagle Ford, Mississippi Lime and Niobrara all grew as well. But in this price recovery, and despite the rebound in the rig count, all those basins show a continuous decline. The Permian Basin is the only shale oil Basin that shows a recovery in supply (albeit a small one). This is not unlike what we have seen in US gas, where shale gas production started in the Barnett shale, then Haynesville Basin outgrew everything else, but now the Marcellus shale is dominating US gas markets.
Exhibit 14: Only the Permian Basin shows some output recovery
b/d

Source: EIA, Goldmoney Research
If this fully repeats in the shale oil space, then production is limited to how much pipeline space can grow out of the Permian. Arguably that was an issue before, but if production continues to decline in other basins, then the Permian has to offset those declines as well. This would further restrict how fast production can growth in the future.
We believe that the necessary focus on profitability, combined with the issue of high decline rates which become more dominate as base production grows, limit US shale oil production growth long term. We don’t think we see production again growing at the record rates of the past, certainly not at these prices. Much higher prices would likely ignite another rush in the sector, but eventually the decline rates will dominate and effetely limit production growth.
The future of global supply growth:
On net, this means that supply will struggle to return to pre-COVID-19 levels quickly as non-OPEC ex US shale will be permanently lower and continue to decline while it will take time for US to reach old highs. US shale oil production is unlikely to grow again at past rates, particularly with current prices. And once US shale production has reached the previous peaks, it will be increasingly difficult to grow much further as high decline rates simply limit to how high production can go. Even before the pandemic, most OPEC countries were already more concerned about maintaining their production rather than growing it over the long run. Low prices and high spare capacity also prompted core OPEC members to lower their CAPEX, at least temporarily.
The duration mismatch between supply and demand peaks
The problem is, while oil producers are preparing for a low carbon future with potentially declining oil demand, oil demand itself will still grow for many years to come. The oil space is facing a duration mismatch.
Oil demand is primarily driven by the transportation sector and to a lower extent by the petrochemical industry and industrial sector as a whole. Together they account for 84% of global oil demand, 87% if demand from the agricultural, forestry and fishing sectors are added (as it is likely also mostly transportation related oil demand). The transportation sector accounts for about 2/3 of global oil demand and it is still growing. The petrochemical sector accounts for 11% and is the fastest growing sector for oil demand. Industrial demand comes in third at 7% and it has been declining for decades.
Exhibit 15: Transportation and petrochemical demand are the largest sectors and growing

Source: Goldmoney Research
There is very little demand left from the power sector and demand from the residential sector is mostly from heating (which has been in a multi decade decline in the OECD countries. See Exhibit 16).
Exhibit 16: Residential oil demand in the OECD has been in a multi decade decline
Toe
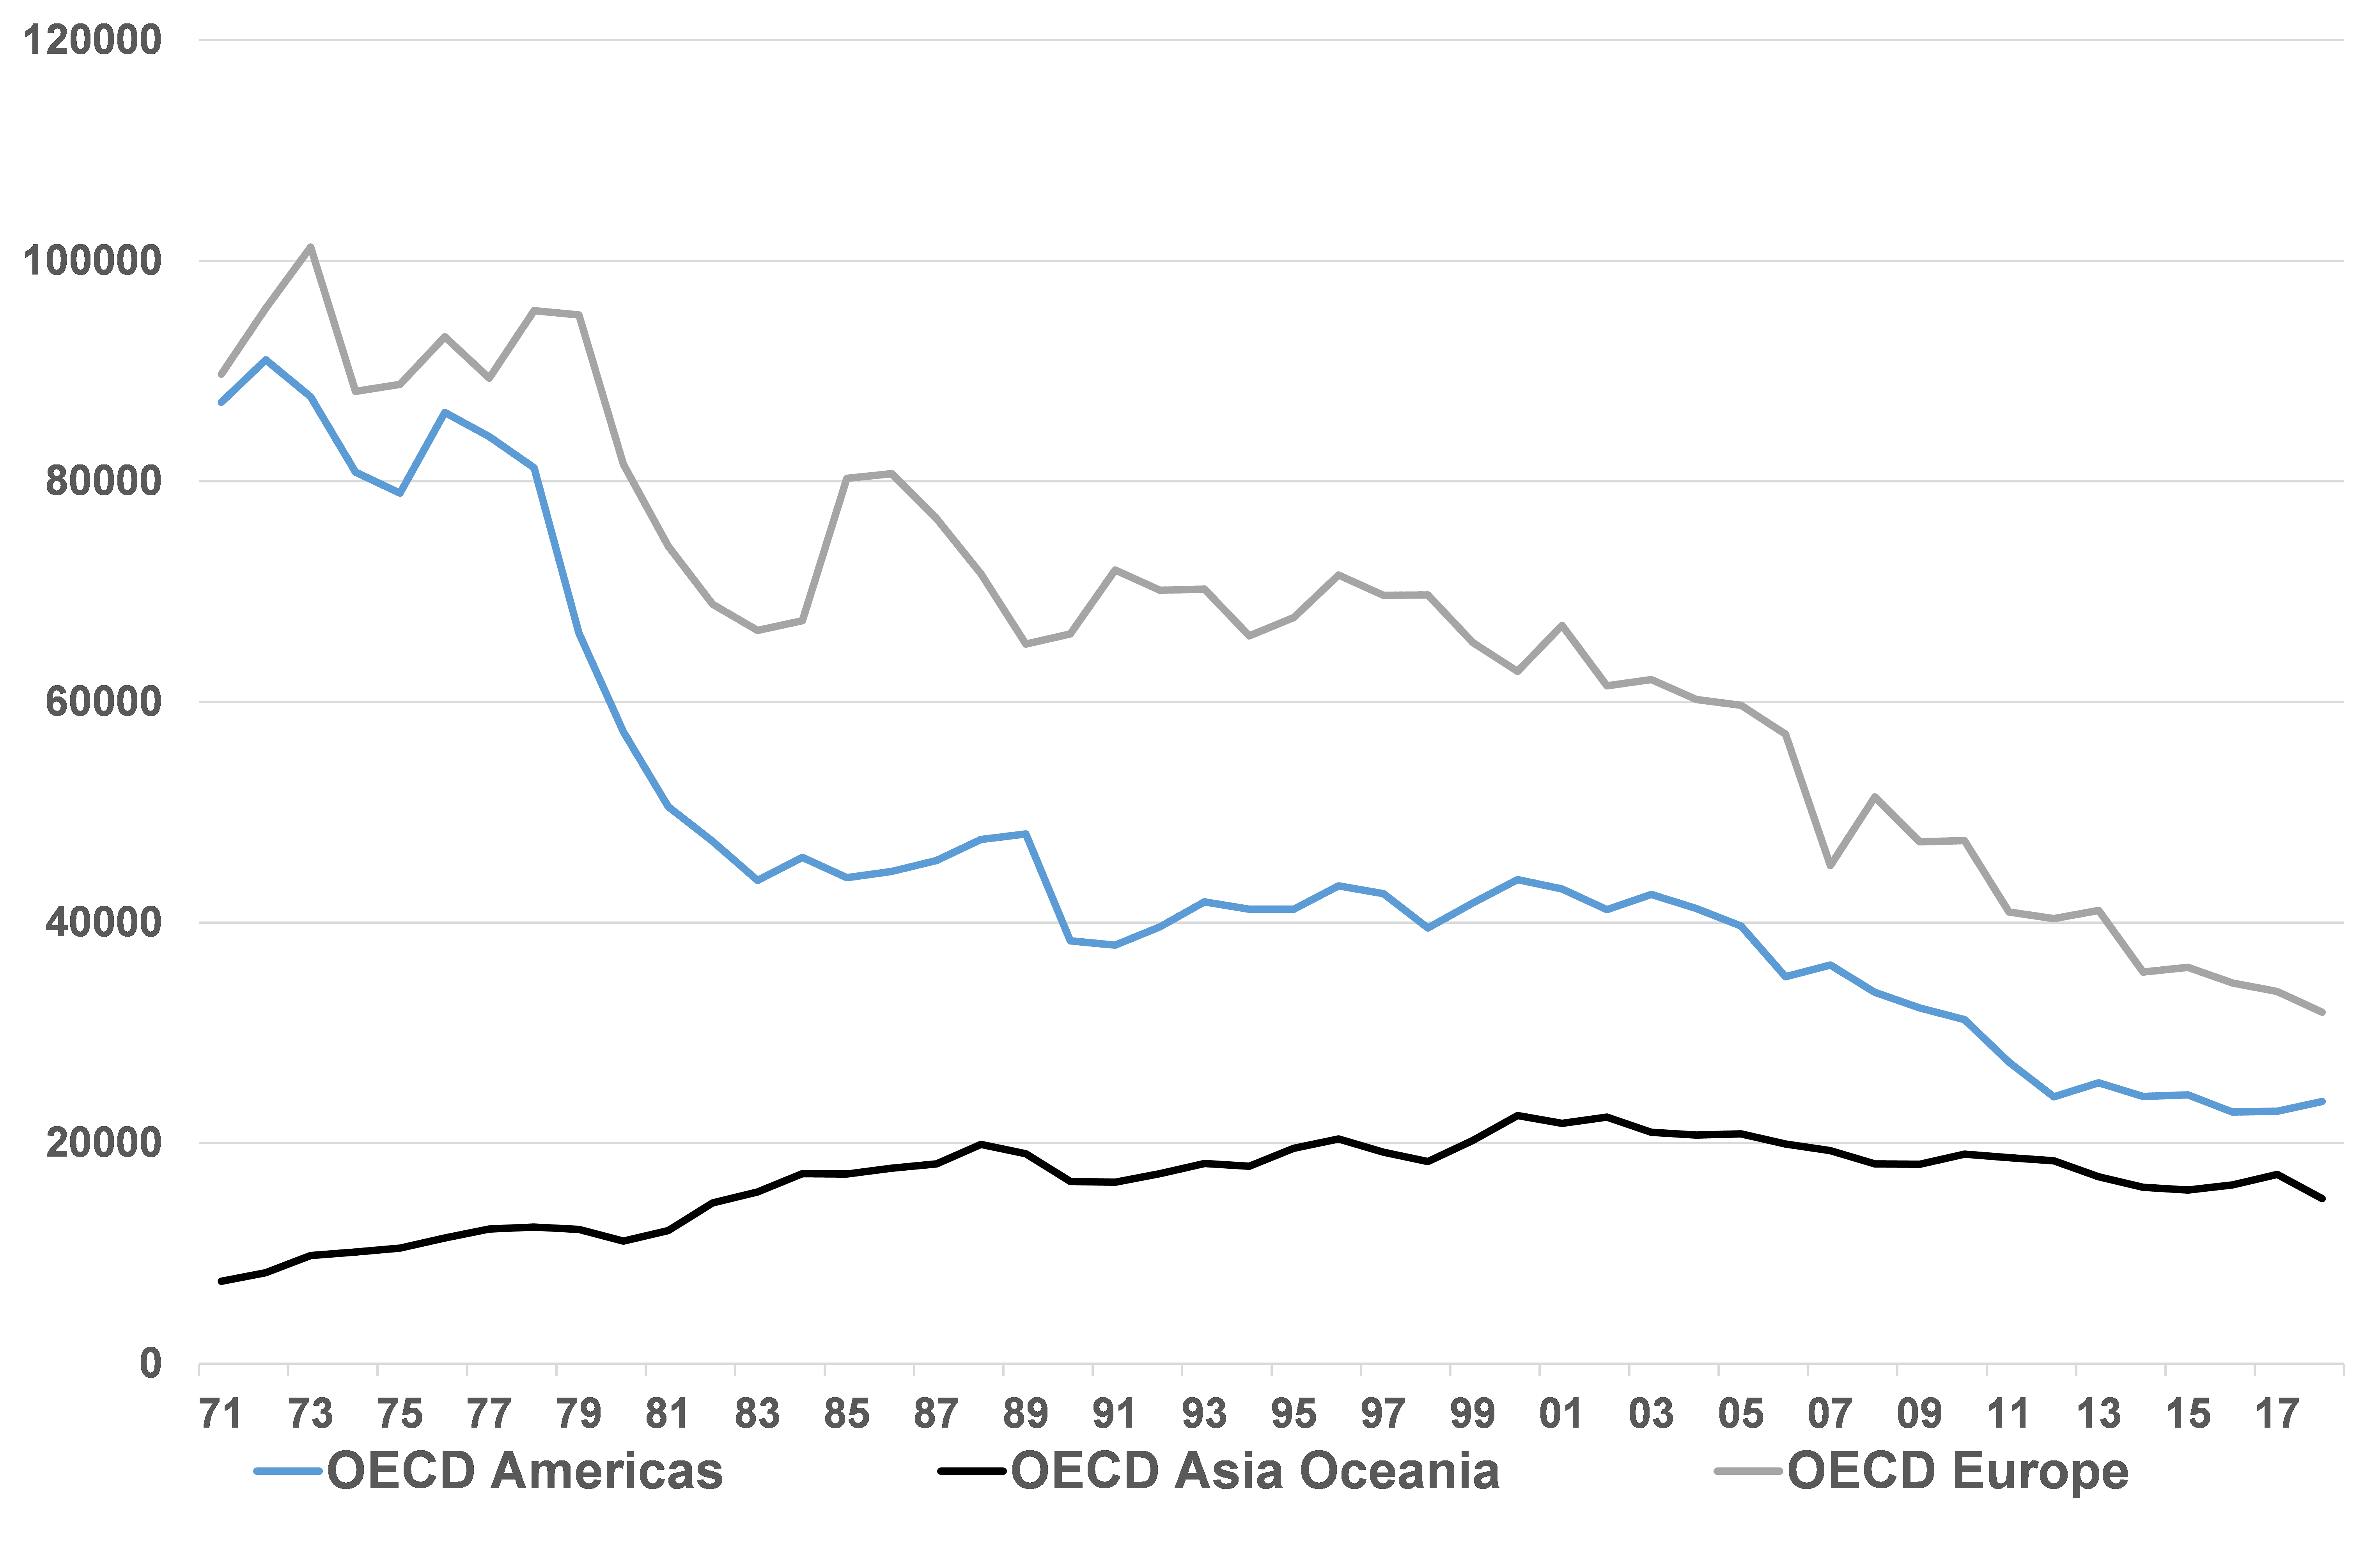
Source: Goldmoney Research
The future of oil demand
Industrial demand will likely continue to decline slowly. Wherever possible it’s substituted as oil tends to be one of the most expensive energy sources compared to power or gas. But this is an ongoing process and the low hanging fruits have been harvested decades ago. Hence this future decline is irrelevant in the grand scheme of things.
In contrast, demand from the petrochemical sector will continue to grow in the foreseeable future as plastics demand will continue to rise with population growth and global economic expansion. We expect Petchem demand growth to offset declines from all sectors other than the transportation sector.
The big question therefore is what will happen to transportation demand. Transportation fuel demand has been declining for many years in most Western economies even as Western economies continued to expand and both the population as whole and mobility continued to rise. This is mainly due to much better fuel economies in transportation vehicles driven mostly by regulations. Importantly, the regulatory frameworks that drive these efficiency gains are not new. In the US, the Corporate Average Fuel Economy (CAFE) standards were introduced already in 1975 as a reaction to the 1973-1974 oil embargo. The regulatory frameworks aims at fuel consumptions directly. The CAFE standards have been continuously tightened over the past 45 years.
Exhibit 17: Fuel efficiencies have been increasing for decades without electrification
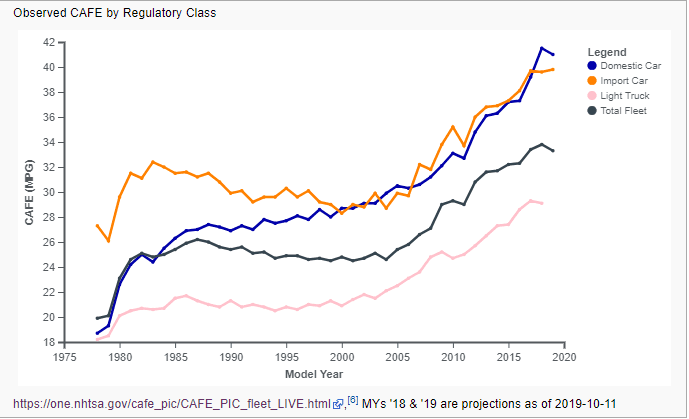
Source: Wikipedia
The European Union adopted a regulatory framework with a dual mandate that not just targets fuel economy, but also emissions. European manufacturers have a binding emission target of CO2 95g/km for the average mass of their vehicles from 2021 onwards. It was CO2 130g/km from 2015-2019. Other OECD nations have similar standards that have tightened over the past decades.
The result is that fuel consumption in most OECD countries has actually peaked a while ago. Countries with high population growth such as the US have seen their overall fuel consumption rising, but not at the same speed as their population and economy was growing.
Exhibit 18: Transportation fuel demand has peaked for most OECD countries many years ago
Kb/d

Source: Goldmoney Research
The main contributor to fuel demand growth over the past 20+ years this were the emerging markets. In Emerging Markets, the fuel economy of newly sold cars is already quite high as the cars sold tend to be smaller, lighter and equipped with smaller engines. According to the SIPA center on global energy policy, the fuel economy of average car sold in China in 2018 was roughly 5.8 liters per 100km, equivalent to 40.5Mpg. In contrast, the average vehicle sold in the US had a fuel economy of around 33.8Mpg. However, given the rapid expansion of the car fleets in these countries, fuel demand has been strongly rising over the past decades.
Importantly, the rise in popularity of hybrid cars and EVs over the past years has not yet lead to a complete change in trend in fuel consumption. The efficiency gains over the past years were still primarily driven by more fuel efficient cars with combustion units. The reason is that despite their popularity, hybrid and full EVs are still only a small fraction of all transportation vehicles sold in the world and even a smaller share of the global car fleet.
According to the international Energy Agency (IEA) roughly 90 million of cars are sold worldwide, up from around 60 million units by 2005. According the IEA, only 2.1 of the vehicles sold in 2019 were electric in some form, which includes hybrid cars.
According to Bloomberg, there are currently 1.2 billion vehicles in the world. According to the IEA, the total electric car flight is just 7 million. Again, this includes hybrid cars.
Exhibit 19: Total electric car fleet

Source: IEA
Arguably the sale of EVs, both hybrid and fully electric cars, has sharply accelerated in recent years. According to the IEA, EV sales increased 30% p.a. from 2016-2018, but then slowed down to 6% in 2019. The slowdown was also driven by lower car sales overall, particularly in China, which until recently accounted for nearly half of all EV sales in the world.
Bloomberg recently published a report in which the company estimates that the share of EVs of total cars sales is expected to grow from 2.7% in 2020 to 10% (8.5mn) by 2025, 28% (26mn) by 2030 and 58% (54mn) by 2040. Accordingly, the global EV fleet is expected to grow to 8.5 million by 2025 and 116 million by 2030. However, Bloomberg estimates that the global vehicle fleet will be around 1.4 billion by 2030. According to the International Organization of Motor Vehicle Manufacturers, around 45 million vehicles have been net added per year in the past 10 years. A continuation of the trend would imply that the global vehicle fleet in 10 years would be closer to 1.6-1.7 billion.
This implies that EVs will still make up just 8% of the global car fleet at best, and that still includes hybrid vehicles, of which some are less fuel efficient than small cars with combustion engines. It also means that the fleet of vehicles with internal combustion engines will still increase by at least 100 million to potentially 400 million units over the next 10 years.
Hence, we believe that the rapid propagation of EVs will have a relatively minor impact on transportation fuel demand over the next ten years. We expect that the average fuel efficiency will continue to increase, but the main driver will continue to be more fuel efficient ICE units rather than electrification. That will start to change after the 2030s if we manage to push EV sales over the 50% mark. This means that the existing car fleet will be gradually replaced by cars that consume little to no transportation fuels. However, for the next 10 years, this means that transportation fuel demand will likely continue to grow, which in turn means, oil demand will likely continue to grow.
Herein lies the duration mismatch between peak supply and peak demand. Once OPEC has brought back all its spare capacity, there is no new significant supply to come online other than US shale oil. But US shale cannot grow for 10+ years at the rate required to meet all the new demand AND offset the declining non-OPEC supply. Hence, eventually, global oil majors will have to sanction some of the projects which they have shelved. But we think this will require much higher prices on the back end. If they don’t, then we face significant supply shortfalls in the medium to long term.
Hence in our view, either longer dated oil prices soon start to reverse their decade long trend and begin to signal producers that their investment is needed. This would be a very positive driver for gold prices. We think the price incentive will have to be substantial as oil producers know that the lifetime of these projects will exceed peak oil demand. Hence, any of the large project sanctioned now will produce decades into an oil market with declining demand. Alternatively, longer dated oil prices don’t reverse the trend now. In that case, we think a massive supply crunch lies ahead of us. In that case, we can expect an explosion in prompt prices, which likely will push the entire price curve higher. The impact on gold would probably be even higher. Either or, we think the trough in longer-dated energy prices in now finally here, and longer-dated energy prices will be supportive to gold going forward.
In the first part of this report (The coming oil shortage – Part I, 20 April 2021), we discussed the impact of longer-dated energy prices on gold. We outlined how production from OPEC+, US shale oil producers and non-OPEC (ex US shale) collapsed on the back of the lockdown induced price crash. In this report we take a close look at these three sources of oil supply and how we expect production to develop as the world recovers from the pandemic.
OPEC+:
OPEC+ production is down because OPEC decided to do so. Production costs for most OPEC producers tends to be very low. Saudi Arabia for example, didn’t need to shut in production because it became uneconomical. They shut in because they didn’t want prices to decline even further. But had global prices declined even further, Saudi, and other core OEPC members, would have been the last ones to see prices drop below their operating costs. Importantly for the future, this production can be turned back on the same way it was shut off, as there hasn’t been any meaningful impact on capacity.
However, that doesn’t mean that the COVID-19 pandemic had no impact on the long term prospects of OPEC oil production. Much like their non-OPEC counterparts, OPEC producers drastically slashed their CAPEX. For example, when Saudi Aramco had its IPO in 2019, the company stated in the IPO prospectus that it plans to spend between $35-40bn in CAPEX in 2020. By March 2020 it had lowered that to $25-30bn. But even as oil prices sharply recovered, Aramco kept revising CAPEX guidance lower. In March 2021 it revised its FY CAPEX target to $35bn from previously $40-45bn, and Aramco is still among the higher spenders among the OPEC countries. ADNOC (Abu Dhabi National Oil Company) revised its 2020 CAPEX down 35%. And while in December last year it celebrated a 5-year spending plan (2021-2025) of $122bn, this was $10bn lower than the previous 5-year plan. KPC (Kuwait Petroleum Corp) announced in March last year that would sharply cut its CAPEX for 2020. The company then announced in August 2020 that it would cut its 5-year spending plan by a whopping 25% by cancelling some projects and postponing others, including exploration.
Less is known about the CAPEX plans of the national oil companies in non-core OPEC nations, but given that they are in much more dire financial situations than Saudi Arabia, the UAE and Kuwait, it’s reasonable to assume that spending cuts will be relatively larger compared to the core members. And while the core OPEC nations rely on their own national oil companies, most non-core members rely on international oil companies to run existing and develop new fields. Many of these companies have drastically reduced their CAPEX outlook (we discuss this further below), including their spending in OPEC countries. Industry consultant Wood Mackenzie estimated last year that international oil companies would cut their spending plans for the African continent by 33%. Seven out of 15 OPEC members are African Nations.
Reduction in CAPEX spending is not the only way future oil output will be impacted. Oil companies drastically reduced operational spending (maintenance) as well. This has a more immediate impact on output than CAPEX cuts. The problem is that reduced operational spending often leads to a permanent capacity impairment. In other words, while voluntary production cuts per see are not necessarily problematic as it just creates spare capacity that can be tapped later when demand returns, reduced maintenance spending can have a permanent impact on a well and production may never return to previous levels. WoodMac estimated last year that some companies operating in Africa cut operational spending by as much as 40%.
On net, while we think that OPEC+ will be able to rapidly fill the supply gap near term with spare capacity when demand returns in 2H21 as normalcy returns. However, the world won’t be able to rely on new OPEC supply medium to long term to meet growing demand. In fact, we think the natural decline of some OPEC members will accelerate going forward. This is a sharp departure from the previous 10 years, where OPEC added 5mb/d of production to meet growing demand. Much of this production was new capacity rather than spare capacity.
Exhibit 9: Since 2010, OPEC added 5mb/d of supply to meet growing demand
Kb/d, OPEC (ex Libya and Iran)
Source: Goldmoney Research
Non-OPEC ex US shale:
Prior to the COVID-19 outbreak, we had argued that 2020 would be the last year of positive non-OPEC ex US shale production growth. Production was expected to grow as projects that had been sanctioned many years ago would finally come online. However, a rapidly depleting project pipeline combined with accelerating natural decline rates would mean that from 2021 onwards, non-OPEC ex US shale would decline in the foreseeable future.
The price crash in 2020 resulted in a production decline already in 2020, as some producers came close to cash costs. Many producers reduced maintenance in their fields, something we had witnessed already in 2008-2009. However, this is a short term effect. The more important effect is that non-OPEC producers massively slashed their CAPEX. Exxon slashed 30% of their 2020 spending and then a further 11-25% in 2020. BP cut their 2020 capital spending by 25%. The company also announced in March 2021 that it would exit its Kazakh oil projects – an important driver of future growth - and would focus on renewables. BP seeks to reduce its hydrocarbon business by 40% over the next ten years. Shell and total cut their 2020 CAPEX by 20% and announced to transform to a greener business, with Shell aiming to become a net-zero energy business by 2050. While some of these divestitures simply mean that existing assets change from a large oil company to another one, it also means that the companies selling their assets will not invest in new projects.
This means, the already dry project pipeline will deplete even faster. This has partially to do with the price shock. But it has equally to do with the realignment of global oil companies towards a greener economy. Many oil and gas majors have announced that they are aiming to invest in renewable energy at the expense of their traditional business. In the past, such announcement were merely more than public relations efforts, but the COVID-19 crisis has probably accelerated the push towards de-carbonization of the economy as well. We expect governments around the world to push for major infrastructure bills in the coming months with a clear focus on “a green new deal”. At the same time, carbon pricing is going global. Energy giants facing the tough decision whether to invest billions of dollars into fossil fuel projects with lead times often exceeding 10 years and lifetimes of 30+ years. Even though these projects may ultimately turn out to be very profitable, they come with a huge amount of uncertainty tied to the future of fossil fuels. This uncertainty problem is not new and has forced oil majors into the shale sector over the past years, as the lead time is much shorter. But with the current outlook, oil companies are probably not just thinking twice but three times to sanction one of those gigantic oil projects.
As result, we think that non-OPEC ex US shale production has likely peaked and will slowly decline from here onwards. Substantially higher prices (on the back end of the curve) will be needed to incentivize oil companies to make the necessary investments, and even if those investments are made, it will take many years for that production to become operational.
Exhibit 10: Non-OPEC ex US shale production is expected to decline in the coming years
Kb/d year-over-year
Source: Goldmoney Research
US shale oil:
US shale oil producers shut in production because it became hugely. A large part of US production even saw negative prices. But even as prices recovered quickly to $40/bbl, hardly any producer could cover their operating costs, let alone being profitable. This lead to a continuous decline in output and only very recently we saw a modest recovery in production. At this point, production is down around 2.5mb/d from peak.
One might argue that we have seen the same dynamics before. Back in 2014, US shale oil production was also growing at breakneck pace. This eventually led to a much oversupplied global market and a price crash from $110/bbl to $30/bbl over 18 months. As a consequence, US shale oil production also sharply declined, which eventually rebalanced the market. Prices recovered and stabilized at around $60-70/bbl. Subsequently US shale producers slowly adapted to the new price environment and by 2019, production again grew at over 2mb/d. But in 2019, the market had not much trouble absorbing that kind of production. In fact, it depended on it.
However, the recent price crash and ensuing production decline doesn’t seem to follow the same path. Oil prices have fully recovered by now, but production has not. In fact, US production is near the lowest it has been since the outbreak of the pandemic. Moreover, drilling activity is also greatly lagging. Arguably the US oil rig count has recovered from 172 in August 2020 to currently 344, but this seems not enough to keep production even constant.
Exhibit 11: US production has yet to show any meaningful recovery despite the full price recovery
Kb/d year-over-year
Source: EIA. Goldmoney Research
In fact, the reason why US shale output is not lower despite this very low rig count is because producers reverted to high grading. High grading means the producers are producing from their most prolific acreage. This also means that any production increase would require a massive redeployment of rigs as new wells would be less prolific than the current ones. But US producers vowed to their investors as well as to their banks that – unlike the last time prices recovered – they would refrain from growing output and focus on profitability instead.
Exhibit 12: As the rig count fell, average production per rig increased due to high grading
B/d and rig count (Permian Basin)
Source: EIA, Goldmoney Research
A further issue is the size of US shale output and the steep decline rates. Unlike shale gas producers which somehow managed to flatten their decline curves, shale oil producers still struggling with decline rates around 70% in the first year. The larger total US shale oil output gets, the more new production has to be brought online to simply offset the decline rates in existing output. This is not a new problem, but the recent reluctance of US producers to grow output at all costs means this issue is now real.
Exhibit 13: Steep decline rates remain a problem as US shale oil output remains high even after the crash
B/d all basins
Source: EIA, Goldmoney Research
The pandemic and the price crash have also accelerated phenomenon that was already known from the shale gas market, but is new to the shale oil market. In the US, there used to be multiple shale oil basins which all showed production growth, albeit at different speeds. The Permian basin became sort of the king of shale oil, but other basins such as the Bakken (the first), Eagle Ford, Mississippi Lime and Niobrara all grew as well. But in this price recovery, and despite the rebound in the rig count, all those basins show a continuous decline. The Permian Basin is the only shale oil Basin that shows a recovery in supply (albeit a small one). This is not unlike what we have seen in US gas, where shale gas production started in the Barnett shale, then Haynesville Basin outgrew everything else, but now the Marcellus shale is dominating US gas markets.
Exhibit 14: Only the Permian Basin shows some output recovery
b/d
Source: EIA, Goldmoney Research
If this fully repeats in the shale oil space, then production is limited to how much pipeline space can grow out of the Permian. Arguably that was an issue before, but if production continues to decline in other basins, then the Permian has to offset those declines as well. This would further restrict how fast production can growth in the future.
We believe that the necessary focus on profitability, combined with the issue of high decline rates which become more dominate as base production grows, limit US shale oil production growth long term. We don’t think we see production again growing at the record rates of the past, certainly not at these prices. Much higher prices would likely ignite another rush in the sector, but eventually the decline rates will dominate and effetely limit production growth.
The future of global supply growth:
On net, this means that supply will struggle to return to pre-COVID-19 levels quickly as non-OPEC ex US shale will be permanently lower and continue to decline while it will take time for US to reach old highs. US shale oil production is unlikely to grow again at past rates, particularly with current prices. And once US shale production has reached the previous peaks, it will be increasingly difficult to grow much further as high decline rates simply limit to how high production can go. Even before the pandemic, most OPEC countries were already more concerned about maintaining their production rather than growing it over the long run. Low prices and high spare capacity also prompted core OPEC members to lower their CAPEX, at least temporarily.
The duration mismatch between supply and demand peaks
The problem is, while oil producers are preparing for a low carbon future with potentially declining oil demand, oil demand itself will still grow for many years to come. The oil space is facing a duration mismatch.
Oil demand is primarily driven by the transportation sector and to a lower extent by the petrochemical industry and industrial sector as a whole. Together they account for 84% of global oil demand, 87% if demand from the agricultural, forestry and fishing sectors are added (as it is likely also mostly transportation related oil demand). The transportation sector accounts for about 2/3 of global oil demand and it is still growing. The petrochemical sector accounts for 11% and is the fastest growing sector for oil demand. Industrial demand comes in third at 7% and it has been declining for decades.
Exhibit 15: Transportation and petrochemical demand are the largest sectors and growing
Source: Goldmoney Research
There is very little demand left from the power sector and demand from the residential sector is mostly from heating (which has been in a multi decade decline in the OECD countries. See Exhibit 16).
Exhibit 16: Residential oil demand in the OECD has been in a multi decade decline
Toe
Source: Goldmoney Research
The future of oil demand
Industrial demand will likely continue to decline slowly. Wherever possible it’s substituted as oil tends to be one of the most expensive energy sources compared to power or gas. But this is an ongoing process and the low hanging fruits have been harvested decades ago. Hence this future decline is irrelevant in the grand scheme of things.
In contrast, demand from the petrochemical sector will continue to grow in the foreseeable future as plastics demand will continue to rise with population growth and global economic expansion. We expect Petchem demand growth to offset declines from all sectors other than the transportation sector.
The big question therefore is what will happen to transportation demand. Transportation fuel demand has been declining for many years in most Western economies even as Western economies continued to expand and both the population as whole and mobility continued to rise. This is mainly due to much better fuel economies in transportation vehicles driven mostly by regulations. Importantly, the regulatory frameworks that drive these efficiency gains are not new. In the US, the Corporate Average Fuel Economy (CAFE) standards were introduced already in 1975 as a reaction to the 1973-1974 oil embargo. The regulatory frameworks aims at fuel consumptions directly. The CAFE standards have been continuously tightened over the past 45 years.
Exhibit 17: Fuel efficiencies have been increasing for decades without electrification
Source: Wikipedia
The European Union adopted a regulatory framework with a dual mandate that not just targets fuel economy, but also emissions. European manufacturers have a binding emission target of CO2 95g/km for the average mass of their vehicles from 2021 onwards. It was CO2 130g/km from 2015-2019. Other OECD nations have similar standards that have tightened over the past decades.
The result is that fuel consumption in most OECD countries has actually peaked a while ago. Countries with high population growth such as the US have seen their overall fuel consumption rising, but not at the same speed as their population and economy was growing.
Exhibit 18: Transportation fuel demand has peaked for most OECD countries many years ago
Kb/d
Source: Goldmoney Research
The main contributor to fuel demand growth over the past 20+ years this were the emerging markets. In Emerging Markets, the fuel economy of newly sold cars is already quite high as the cars sold tend to be smaller, lighter and equipped with smaller engines. According to the SIPA center on global energy policy, the fuel economy of average car sold in China in 2018 was roughly 5.8 liters per 100km, equivalent to 40.5Mpg. In contrast, the average vehicle sold in the US had a fuel economy of around 33.8Mpg. However, given the rapid expansion of the car fleets in these countries, fuel demand has been strongly rising over the past decades.
Importantly, the rise in popularity of hybrid cars and EVs over the past years has not yet lead to a complete change in trend in fuel consumption. The efficiency gains over the past years were still primarily driven by more fuel efficient cars with combustion units. The reason is that despite their popularity, hybrid and full EVs are still only a small fraction of all transportation vehicles sold in the world and even a smaller share of the global car fleet.
According to the international Energy Agency (IEA) roughly 90 million of cars are sold worldwide, up from around 60 million units by 2005. According the IEA, only 2.1 of the vehicles sold in 2019 were electric in some form, which includes hybrid cars.
According to Bloomberg, there are currently 1.2 billion vehicles in the world. According to the IEA, the total electric car flight is just 7 million. Again, this includes hybrid cars.
Exhibit 19: Total electric car fleet
Source: IEA
Arguably the sale of EVs, both hybrid and fully electric cars, has sharply accelerated in recent years. According to the IEA, EV sales increased 30% p.a. from 2016-2018, but then slowed down to 6% in 2019. The slowdown was also driven by lower car sales overall, particularly in China, which until recently accounted for nearly half of all EV sales in the world.
Bloomberg recently published a report in which the company estimates that the share of EVs of total cars sales is expected to grow from 2.7% in 2020 to 10% (8.5mn) by 2025, 28% (26mn) by 2030 and 58% (54mn) by 2040. Accordingly, the global EV fleet is expected to grow to 8.5 million by 2025 and 116 million by 2030. However, Bloomberg estimates that the global vehicle fleet will be around 1.4 billion by 2030. According to the International Organization of Motor Vehicle Manufacturers, around 45 million vehicles have been net added per year in the past 10 years. A continuation of the trend would imply that the global vehicle fleet in 10 years would be closer to 1.6-1.7 billion.
This implies that EVs will still make up just 8% of the global car fleet at best, and that still includes hybrid vehicles, of which some are less fuel efficient than small cars with combustion engines. It also means that the fleet of vehicles with internal combustion engines will still increase by at least 100 million to potentially 400 million units over the next 10 years.
Hence, we believe that the rapid propagation of EVs will have a relatively minor impact on transportation fuel demand over the next ten years. We expect that the average fuel efficiency will continue to increase, but the main driver will continue to be more fuel efficient ICE units rather than electrification. That will start to change after the 2030s if we manage to push EV sales over the 50% mark. This means that the existing car fleet will be gradually replaced by cars that consume little to no transportation fuels. However, for the next 10 years, this means that transportation fuel demand will likely continue to grow, which in turn means, oil demand will likely continue to grow.
Herein lies the duration mismatch between peak supply and peak demand. Once OPEC has brought back all its spare capacity, there is no new significant supply to come online other than US shale oil. But US shale cannot grow for 10+ years at the rate required to meet all the new demand AND offset the declining non-OPEC supply. Hence, eventually, global oil majors will have to sanction some of the projects which they have shelved. But we think this will require much higher prices on the back end. If they don’t, then we face significant supply shortfalls in the medium to long term.
Hence in our view, either longer dated oil prices soon start to reverse their decade long trend and begin to signal producers that their investment is needed. This would be a very positive driver for gold prices. We think the price incentive will have to be substantial as oil producers know that the lifetime of these projects will exceed peak oil demand. Hence, any of the large project sanctioned now will produce decades into an oil market with declining demand. Alternatively, longer dated oil prices don’t reverse the trend now. In that case, we think a massive supply crunch lies ahead of us. In that case, we can expect an explosion in prompt prices, which likely will push the entire price curve higher. The impact on gold would probably be even higher. Either or, we think the trough in longer-dated energy prices in now finally here, and longer-dated energy prices will be supportive to gold going forward.
| The views and opinions expressed in this article are those of the author(s) and do not reflect those of Goldmoney or Menē, unless expressly stated. Please note that neither Goldmoney, Menē, nor any of its representatives provide financial, legal, tax, investment, or other advice. Such advice should be sought from an independent regulated person or body who is suitably qualified to do so. Any information provided in this article is provided solely as general market commentary and does not constitute advice. Neither Goldmoney nor Menē will accept liability for any loss or damage, which may arise directly or indirectly from your use of or reliance on such information. Goldmoney is a shareholder of Menē, the author a director and shareholder of Goldmoney, and has, therefore, an indirect interest in Menē. |