Silver – the rally is yet to come
Feb 24, 2021·Goldmoney InsightsSilver prices have been on a rollercoaster ride over the past weeks, probably also fueled by social media activity. However, we think silver has solid fundamental support at these levels and risks over the medium-term are strongly skewed to the upside.
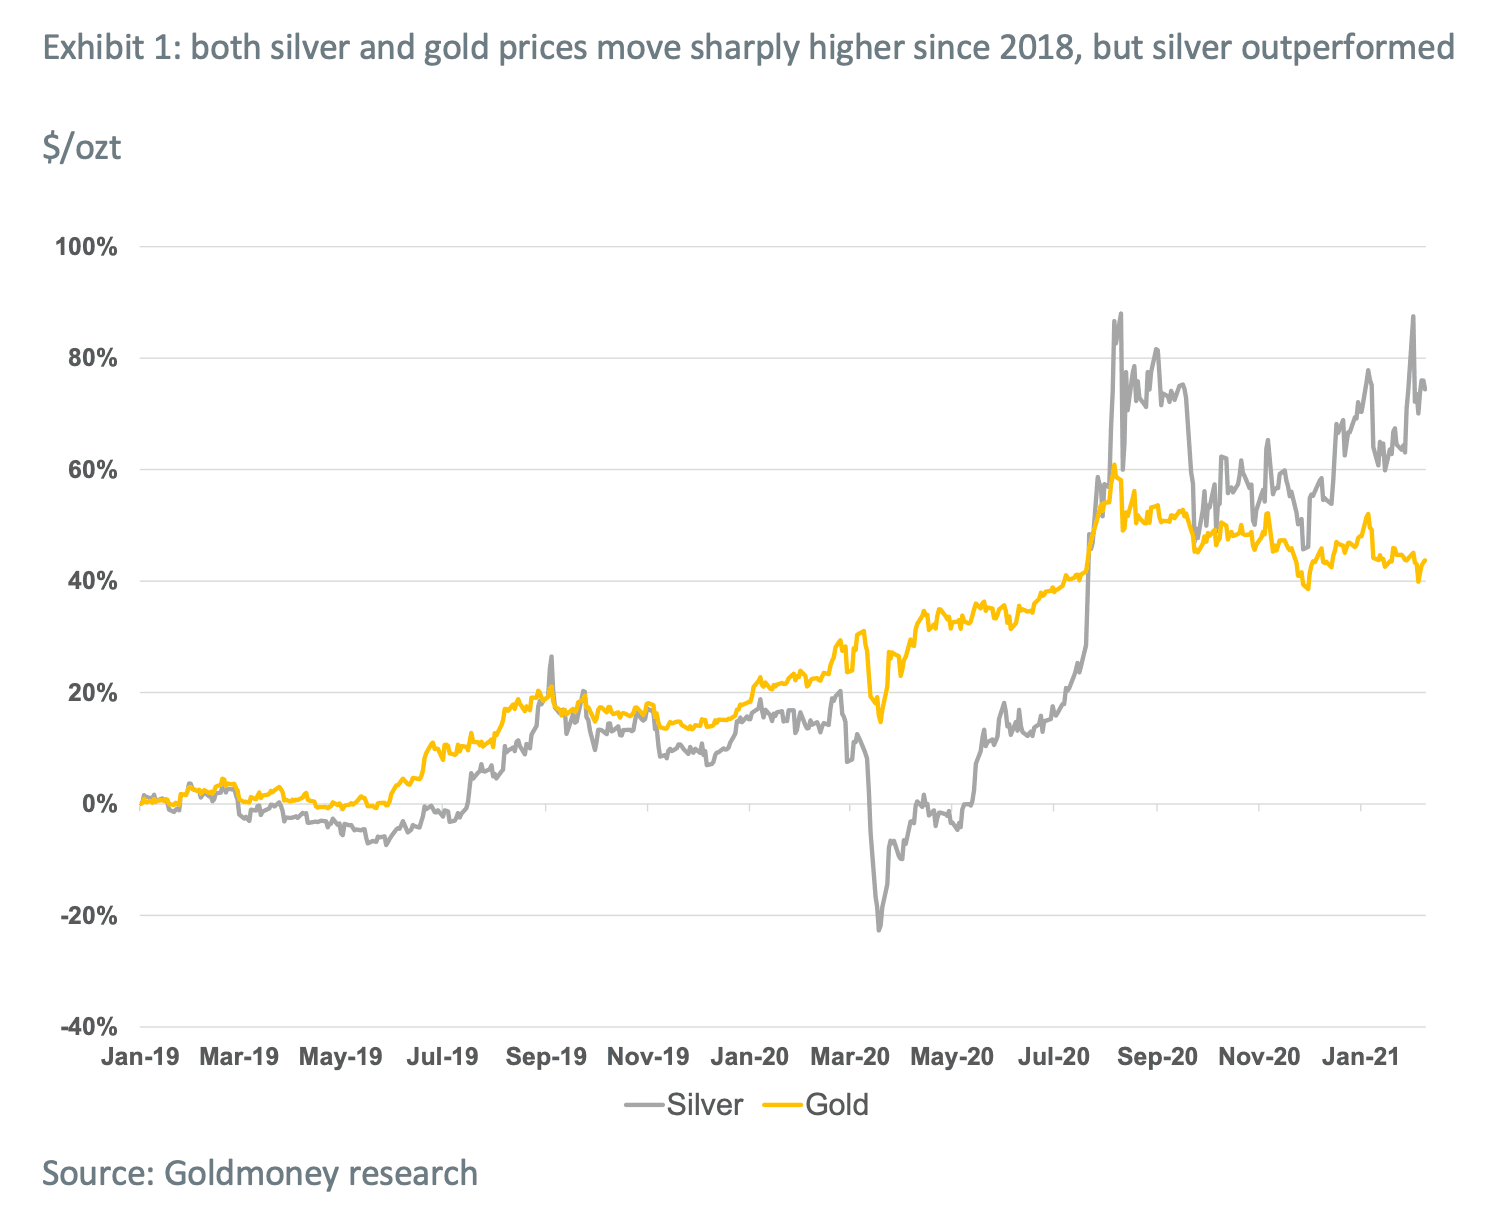
Four years ago, we presented our silver price framework in which we attempted to identify the fundamental drivers of silver prices (Silver price framework: Both money and a commodity, March 9, 2017). In summer of 2019, we published a report and revisited our silver price model. In that report we concluded that silver prices have “explosive upside”, (Silver prices with explosive upside, August 15, 2019). At the time, silver traded at around $16/ozt. A year later, they traded at $26/ozt, slightly below current levels (see exhibit 1). We are now looking at an environment where we once again expect risks to be strongly skewed to the upside, and the next move in silver could be much larger.
In order to understand our current view, it is useful to revisit our 2019 report and the reasons why we were positive for the metal back then. As we have outlined in our silver price framework, silver is both money (store of value) and an input commodity. Unlike gold, which is simply money, silver is impacted both by changes in monetary demand and industrial demand. From our original silver price framework:
Moreover, silver prices have not just detached from gold, they have detached from the predicted levels in our pricing model as well (see Exhibit 4). Our model predicts that prices should currently be roughly at US$25/ozt – US$8/ozt higher than they are. Importantly, when silver prices bottomed in late 2015, prices were exactly in line with the predicted levels from our model. Subsequently, our model would have predicted prices to rise on the back of slowly declining real-interest rate expectations and a modest growth in industrial output. The decline in real-interest rate expectations did lead to rising gold prices, but silver prices did not follow.
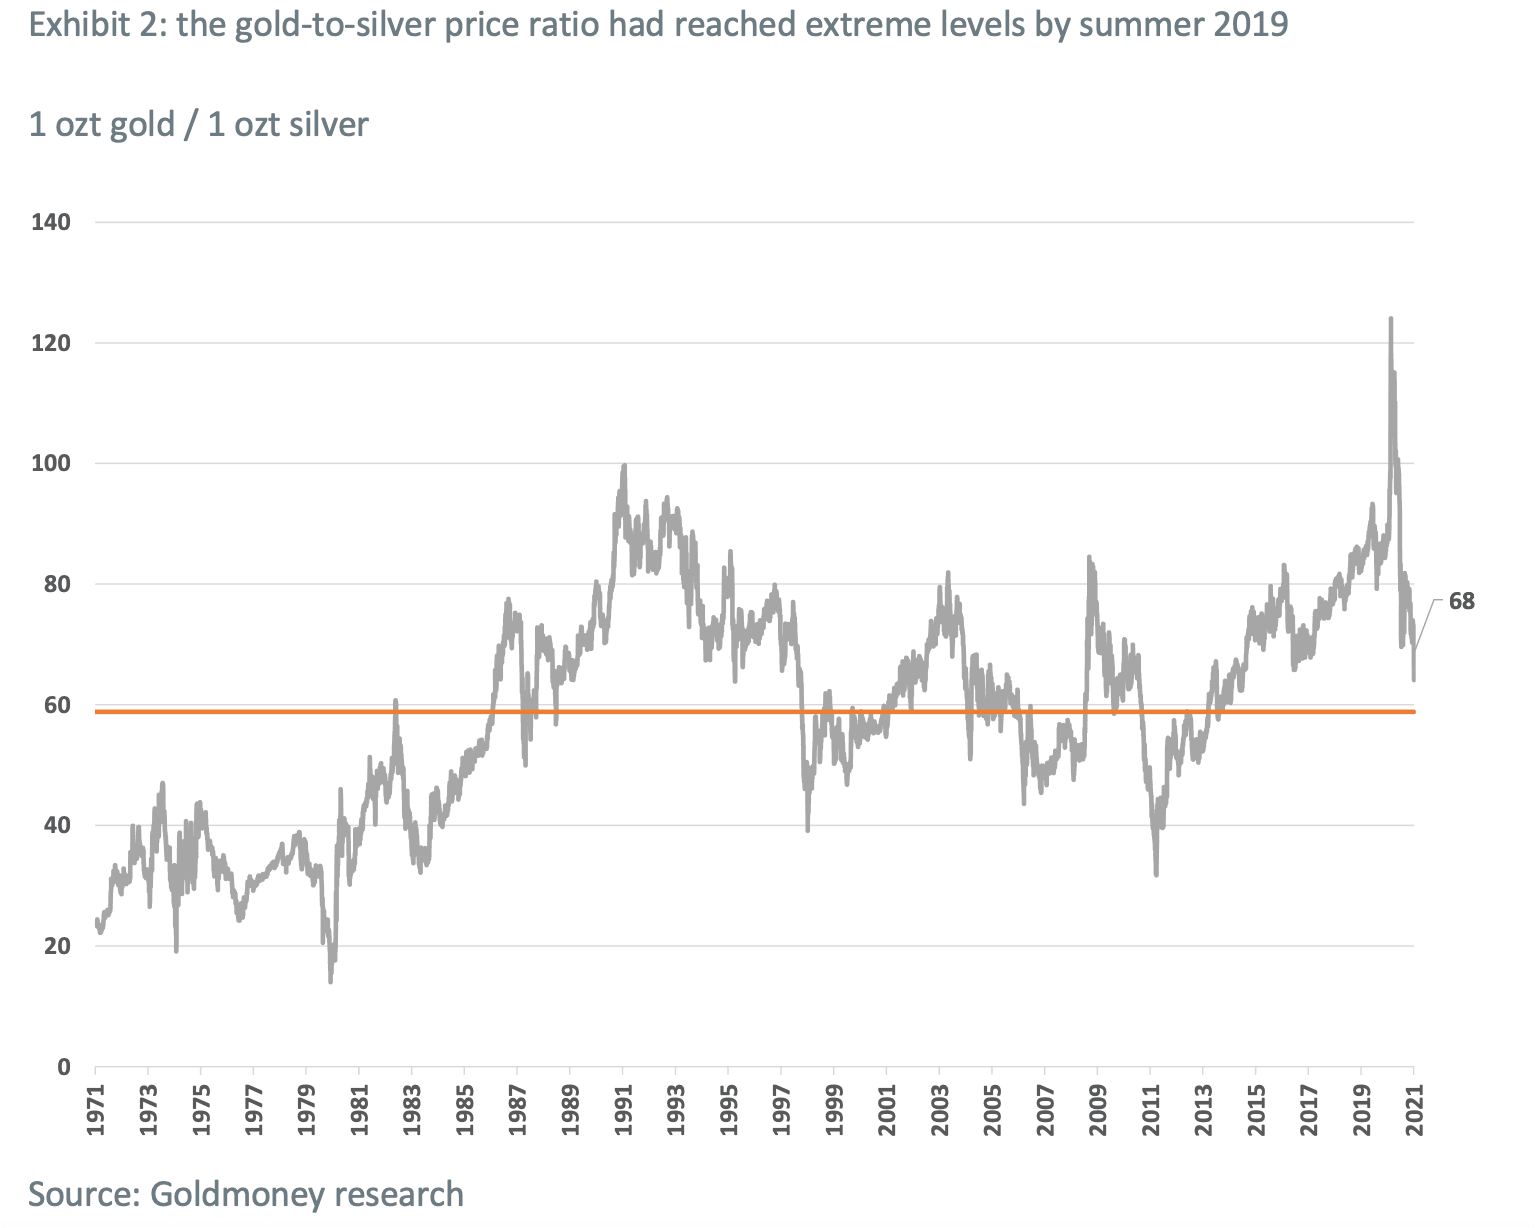
So why was silver lagging gold in the years up to 2019? Back then, we concluded that the historical relationship between broad industrial production and industrial silver demand had broken down as demand from the photography industry had collapsed. While demand from other sectors (photovoltaic) had offset some of this loss, it was yet too small in comparison. This had pushed the silver-to-gold price ratio over 90, while the historical average since 1971 was closer to 60 (see exhibit 2).
However, we also concluded that industrial demand had likely bottomed at that point, as there was hardly any demand from the photography sector left and demand from the other industries kept growing. In addition, mine supply had peaked in 2016 (see exhibit 3). This decline in primary mine supply also helped to compensate for the loss in demand from the photography sector. As we expected mine supply to continue to decline while photography demand had not much room left to decrease, this would become a supportive factor going forward (and indeed mining output continued its downward trend in 2020).

Hence, by mid-2019, we concluded that the headwinds from the industrial sector that plagued silver prices were likely to be a thing of the past. As a result, we expected silver prices to eventually close the gap to gold, which implied a substantial increase in the price.
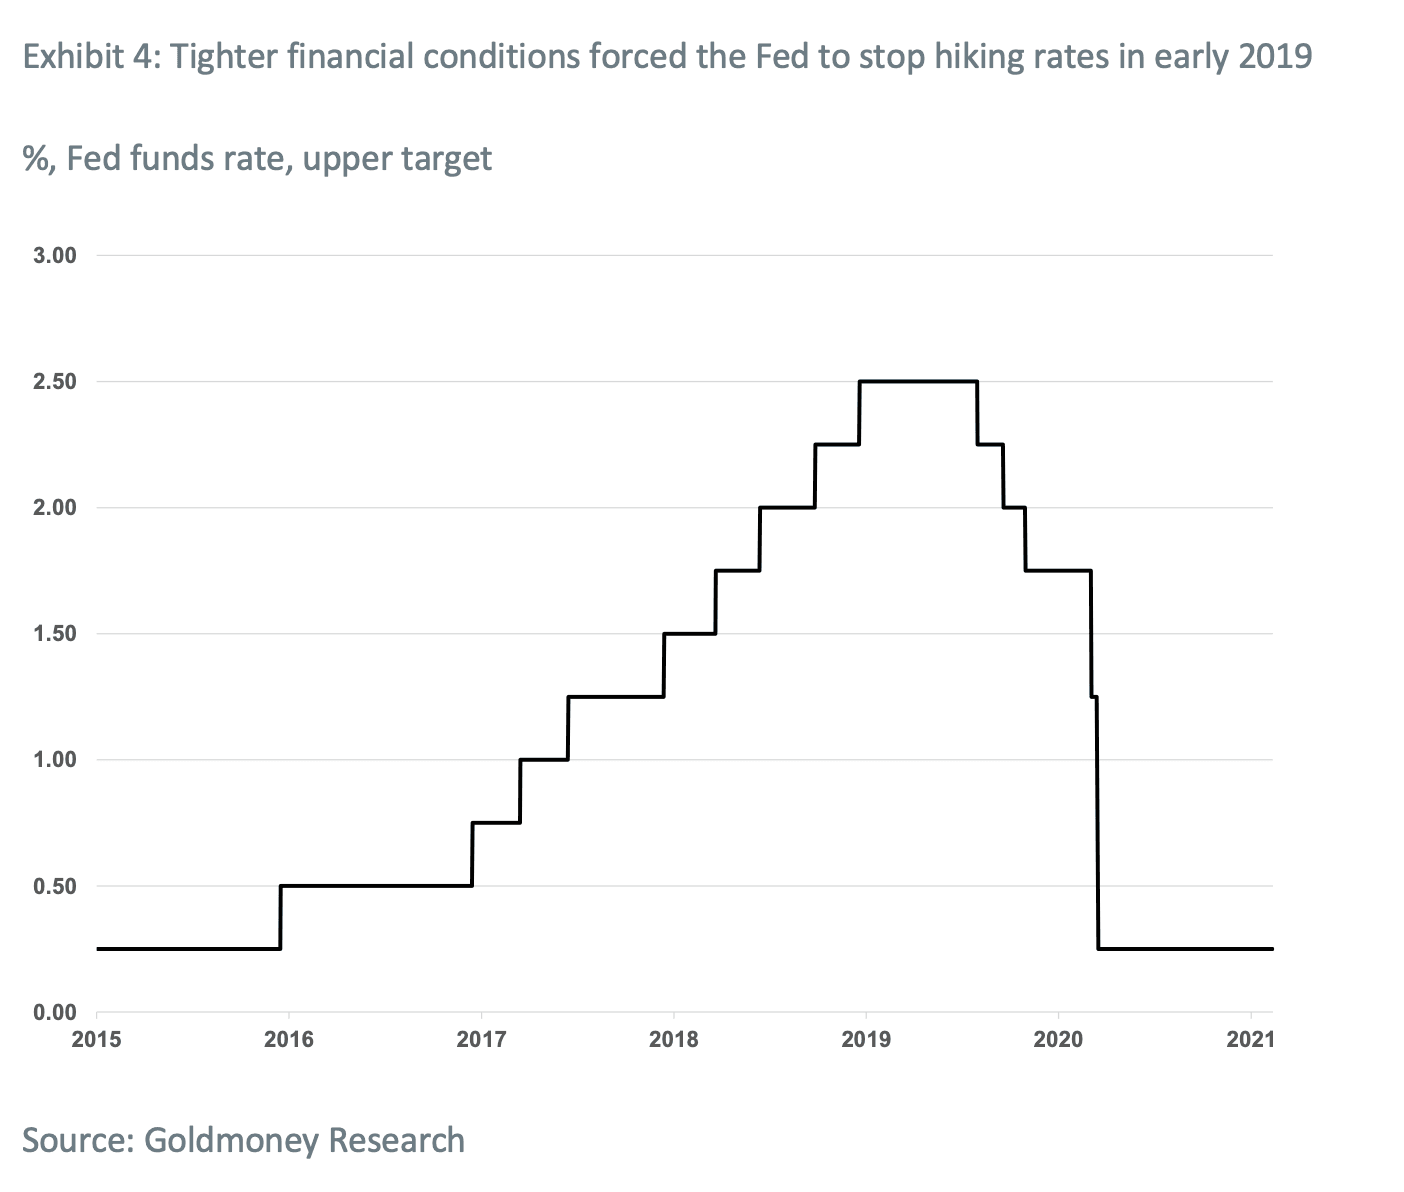
As there were no more headwinds from the industrial side, monetary demand would become the dominant driver for silver going forward. Importantly, by August 2019, we had become increasingly optimistic for monetary demand for precious metals in general as the Fed had started a new rate cut cycle. The Fed had been raising rates since late 2015. This lasted until early 2019, when financial conditions began to tighten, forcing the Fed to pause (see exhibit 4).
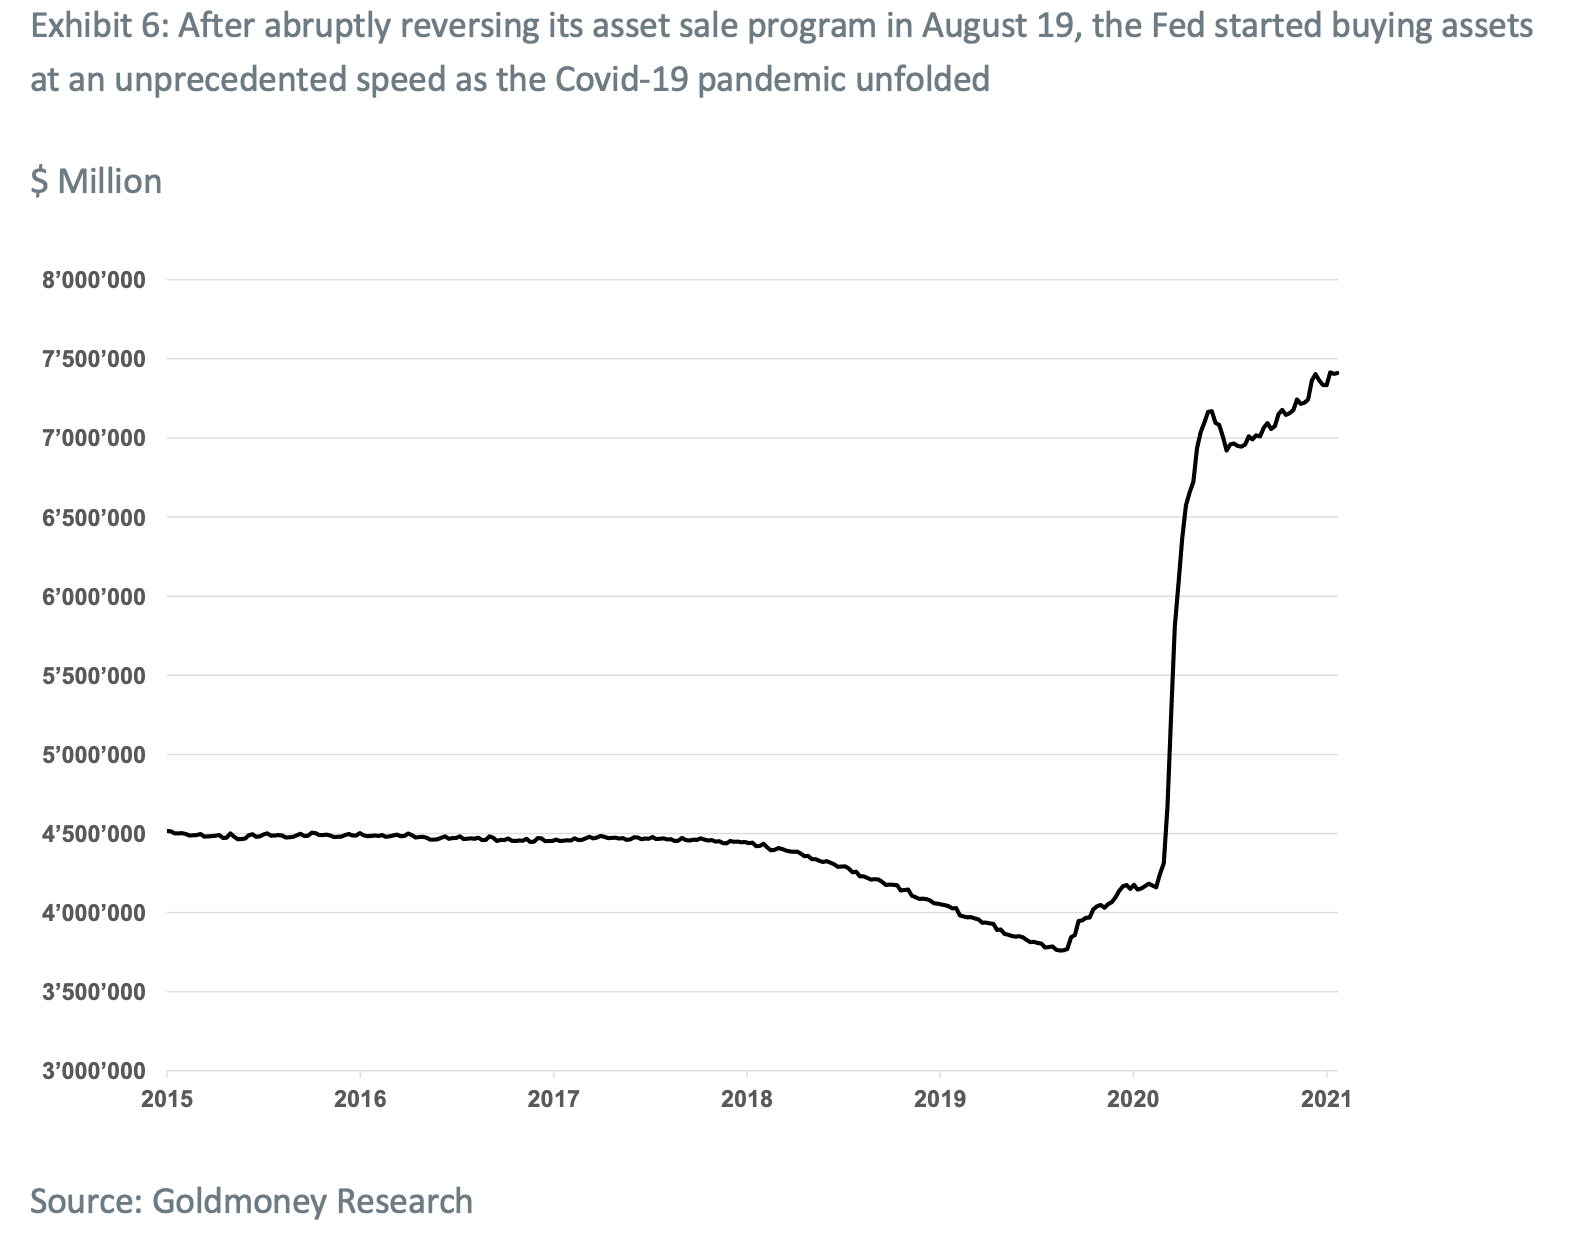
On July 31 that same year, financial conditions had worsened to the point that the Fed had to cut rates for the first time in a decade. Shortly thereafter, it abruptly ended the sale back of assets on the balance sheet and started to aggressively buying assets. This swing in central bank policy came amidst substantial turmoil in the repo markets. Due to all of this, we concluded the Feds tightening cycle had ended, and we would see a period of rate cuts and continued asset purchases by the central bank, which in turn would push precious metals prices higher.
As we have outlined before, when gold and silver rise due to increased monetary demand, silver tends to outperform gold (see exhibit 5). Hence, the combination of strong monetary tailwinds and the potential for gold prices to catch up as industrial headwinds had disappeared, led us to the conclusion that silver prices had explosive upside.

The Covid-19 pandemic led to a paradigm shift in monetary policy
What came next we could have hardly predicted. Initially, the Covid-19 pandemic sent asset prices spiraling. Both, gold and silver, crashed. Silver even more so than gold, because now, once again, industrial demand was at risk. However, central banks almost instantaneously reacted as we would have expected and began to aggressively flood the market with liquidity, slashing rates to zero and buying assets at an unprecedented speed (see exhibit 6).
Thus, the bear market in precious metals proofed to be very short lived, and by mid-2020, gold had made a new all-time high and silver had doubled in price. This sharp upward move in silver closed the gap between the actual price of silver and what our model predicts (see exhibit 7).

Fast forward to today and the outlook is very bullish for precious metals. As we have outlined in our recently published report on gold (Gold Price Framework Update – the New Cycle Accelerates, January 28, 2021), we believe the 25% rally in gold last year marks only the beginning of the current gold price cycle.
We expect the risk for all drivers for the gold price to remain firmly skewed in favor of gold. Real-interest rate expectations are currently at their lowest point in history, but historical central bank action after a recession suggests that there is a lot of room to the downside. Longer-dated energy prices crashed as the global Covid-19 pandemic unfolded, which will accelerate the energy supply crunch we have been expecting for the coming years. And there is no evidence that the long-term trend of growing central bank gold reserves is reversing anytime soon.
And further:
Should real-interest rates fall to a similar extent as they have historically in the aftermath of a recession, that alone would push gold prices to around $2600-3100. Such a move over the entire gold price cycle would be in line with the 2008-2011 move of around 270% from bottom to top. Importantly, this scenario would still not assume a sharp pick up of inflation.
This bodes very well for silver prices. While industrial demand for silver will be likely to remain subdued for some time due to the sustained damage to the global economy, this will be more than offset by monetary demand going forward.
Importantly, while the gold-silver price ratio has come off substantially from its highs in early 2020 of around 120 to around 70 as of today, it is still well above the long-term average and it is well above the ratio when gold peaked in 2011. Back then, the gold-to-silver ratio had fallen to 40. A reversal to a ratio of 40 alone would imply silver prices of $46/ozt. However, we expect such a reversal would only come on the back of substantially higher gold prices, which in turn also implies even higher silver prices.
The views and opinions expressed in this article are those of the author(s) and do not reflect those of Goldmoney, unless expressly stated. The article is for general information purposes only and does not constitute either Goldmoney or the author(s) providing you with legal, financial, tax, investment, or accounting advice. You should not act or rely on any information contained in the article without first seeking independent professional advice. Care has been taken to ensure that the information in the article is reliable; however, Goldmoney does not represent that it is accurate, complete, up-to-date and/or to be taken as an indication of future results and it should not be relied upon as such. Goldmoney will not be held responsible for any claim, loss, damage, or inconvenience caused as a result of any information or opinion contained in this article and any action taken as a result of the opinions and information contained in this article is at your own risk.
Four years ago, we presented our silver price framework in which we attempted to identify the fundamental drivers of silver prices (Silver price framework: Both money and a commodity, March 9, 2017). In summer of 2019, we published a report and revisited our silver price model. In that report we concluded that silver prices have “explosive upside”, (Silver prices with explosive upside, August 15, 2019). At the time, silver traded at around $16/ozt. A year later, they traded at $26/ozt, slightly below current levels (see exhibit 1). We are now looking at an environment where we once again expect risks to be strongly skewed to the upside, and the next move in silver could be much larger.
In order to understand our current view, it is useful to revisit our 2019 report and the reasons why we were positive for the metal back then. As we have outlined in our silver price framework, silver is both money (store of value) and an input commodity. Unlike gold, which is simply money, silver is impacted both by changes in monetary demand and industrial demand. From our original silver price framework:
- On the one hand, silver is a counterparty-risk-free form of money where replacement costs set the lower boundary for prices – the same energy proof of value that underlies gold prices. Thus, silver should be impacted upon by the same drivers as gold prices: Real-interest rate expectations, central bank policy, and longer-dated energy prices.
- On the other hand, silver is a commodity with extensive industrial applications. Hence, changes in industrial activity should impact the price of silver as well.
Moreover, silver prices have not just detached from gold, they have detached from the predicted levels in our pricing model as well (see Exhibit 4). Our model predicts that prices should currently be roughly at US$25/ozt – US$8/ozt higher than they are. Importantly, when silver prices bottomed in late 2015, prices were exactly in line with the predicted levels from our model. Subsequently, our model would have predicted prices to rise on the back of slowly declining real-interest rate expectations and a modest growth in industrial output. The decline in real-interest rate expectations did lead to rising gold prices, but silver prices did not follow.
So why was silver lagging gold in the years up to 2019? Back then, we concluded that the historical relationship between broad industrial production and industrial silver demand had broken down as demand from the photography industry had collapsed. While demand from other sectors (photovoltaic) had offset some of this loss, it was yet too small in comparison. This had pushed the silver-to-gold price ratio over 90, while the historical average since 1971 was closer to 60 (see exhibit 2).
However, we also concluded that industrial demand had likely bottomed at that point, as there was hardly any demand from the photography sector left and demand from the other industries kept growing. In addition, mine supply had peaked in 2016 (see exhibit 3). This decline in primary mine supply also helped to compensate for the loss in demand from the photography sector. As we expected mine supply to continue to decline while photography demand had not much room left to decrease, this would become a supportive factor going forward (and indeed mining output continued its downward trend in 2020).
Hence, by mid-2019, we concluded that the headwinds from the industrial sector that plagued silver prices were likely to be a thing of the past. As a result, we expected silver prices to eventually close the gap to gold, which implied a substantial increase in the price.
As there were no more headwinds from the industrial side, monetary demand would become the dominant driver for silver going forward. Importantly, by August 2019, we had become increasingly optimistic for monetary demand for precious metals in general as the Fed had started a new rate cut cycle. The Fed had been raising rates since late 2015. This lasted until early 2019, when financial conditions began to tighten, forcing the Fed to pause (see exhibit 4).
On July 31 that same year, financial conditions had worsened to the point that the Fed had to cut rates for the first time in a decade. Shortly thereafter, it abruptly ended the sale back of assets on the balance sheet and started to aggressively buying assets. This swing in central bank policy came amidst substantial turmoil in the repo markets. Due to all of this, we concluded the Feds tightening cycle had ended, and we would see a period of rate cuts and continued asset purchases by the central bank, which in turn would push precious metals prices higher.
As we have outlined before, when gold and silver rise due to increased monetary demand, silver tends to outperform gold (see exhibit 5). Hence, the combination of strong monetary tailwinds and the potential for gold prices to catch up as industrial headwinds had disappeared, led us to the conclusion that silver prices had explosive upside.
The Covid-19 pandemic led to a paradigm shift in monetary policy
What came next we could have hardly predicted. Initially, the Covid-19 pandemic sent asset prices spiraling. Both, gold and silver, crashed. Silver even more so than gold, because now, once again, industrial demand was at risk. However, central banks almost instantaneously reacted as we would have expected and began to aggressively flood the market with liquidity, slashing rates to zero and buying assets at an unprecedented speed (see exhibit 6).
Thus, the bear market in precious metals proofed to be very short lived, and by mid-2020, gold had made a new all-time high and silver had doubled in price. This sharp upward move in silver closed the gap between the actual price of silver and what our model predicts (see exhibit 7).
Fast forward to today and the outlook is very bullish for precious metals. As we have outlined in our recently published report on gold (Gold Price Framework Update – the New Cycle Accelerates, January 28, 2021), we believe the 25% rally in gold last year marks only the beginning of the current gold price cycle.
We expect the risk for all drivers for the gold price to remain firmly skewed in favor of gold. Real-interest rate expectations are currently at their lowest point in history, but historical central bank action after a recession suggests that there is a lot of room to the downside. Longer-dated energy prices crashed as the global Covid-19 pandemic unfolded, which will accelerate the energy supply crunch we have been expecting for the coming years. And there is no evidence that the long-term trend of growing central bank gold reserves is reversing anytime soon.
And further:
Should real-interest rates fall to a similar extent as they have historically in the aftermath of a recession, that alone would push gold prices to around $2600-3100. Such a move over the entire gold price cycle would be in line with the 2008-2011 move of around 270% from bottom to top. Importantly, this scenario would still not assume a sharp pick up of inflation.
This bodes very well for silver prices. While industrial demand for silver will be likely to remain subdued for some time due to the sustained damage to the global economy, this will be more than offset by monetary demand going forward.
Importantly, while the gold-silver price ratio has come off substantially from its highs in early 2020 of around 120 to around 70 as of today, it is still well above the long-term average and it is well above the ratio when gold peaked in 2011. Back then, the gold-to-silver ratio had fallen to 40. A reversal to a ratio of 40 alone would imply silver prices of $46/ozt. However, we expect such a reversal would only come on the back of substantially higher gold prices, which in turn also implies even higher silver prices.
The views and opinions expressed in this article are those of the author(s) and do not reflect those of Goldmoney, unless expressly stated. The article is for general information purposes only and does not constitute either Goldmoney or the author(s) providing you with legal, financial, tax, investment, or accounting advice. You should not act or rely on any information contained in the article without first seeking independent professional advice. Care has been taken to ensure that the information in the article is reliable; however, Goldmoney does not represent that it is accurate, complete, up-to-date and/or to be taken as an indication of future results and it should not be relied upon as such. Goldmoney will not be held responsible for any claim, loss, damage, or inconvenience caused as a result of any information or opinion contained in this article and any action taken as a result of the opinions and information contained in this article is at your own risk.