Silver prices with explosive upside
Aug 15, 2019·Goldmoney InsightsSilver prices have lagged gold prices since 2017 which has pushed the gold-to-silver ratio close to the all-time high. Silver prices are also significantly below what is predicted by our pricing model. We think that the reasons for this subdued performance are transitory and that silver will outperform gold again as the next precious metals cycle continues to rapidly unfold.
In spring 2017, we introduced a framework for understanding the formation of silver prices (Silver price framework: Both money and a commodity, March 9, 2017). In this report we are going to use this framework to analyze the recent performance of silver and give an outlook for where we think silver is heading over the coming months. In our framework piece, we concluded that silver is both money (store of value) and an input commodity and thus the impact of both industrial and monetary demand needs to be taken into consideration:
- On the one hand, silver is a counterparty-risk-free form of money where replacement costs set the lower boundary for prices – the same energy proof of value that underlies gold prices. Thus, silver should be impacted by the same drivers as gold prices: Real-interest rate expectations, central bank policy, and longer-dated energy prices.
- On the other hand, silver is a commodity with extensive industrial applications. Hence, changes in industrial activity should impact the price of silver as well.
In our framework note, we also discussed the two main reasons why we think that silver tends to outperform gold in bull markets and underperform in bear markets:
- Because the value of global silver stocks is much smaller than that of global gold stocks – which is the result of silver being used in industrial applications – a rise in monetary demand for silver has a disproportionally large effect. In other words, when demand for metals increases as an alternative to fiat currency, there is simply less silver around to change hands.
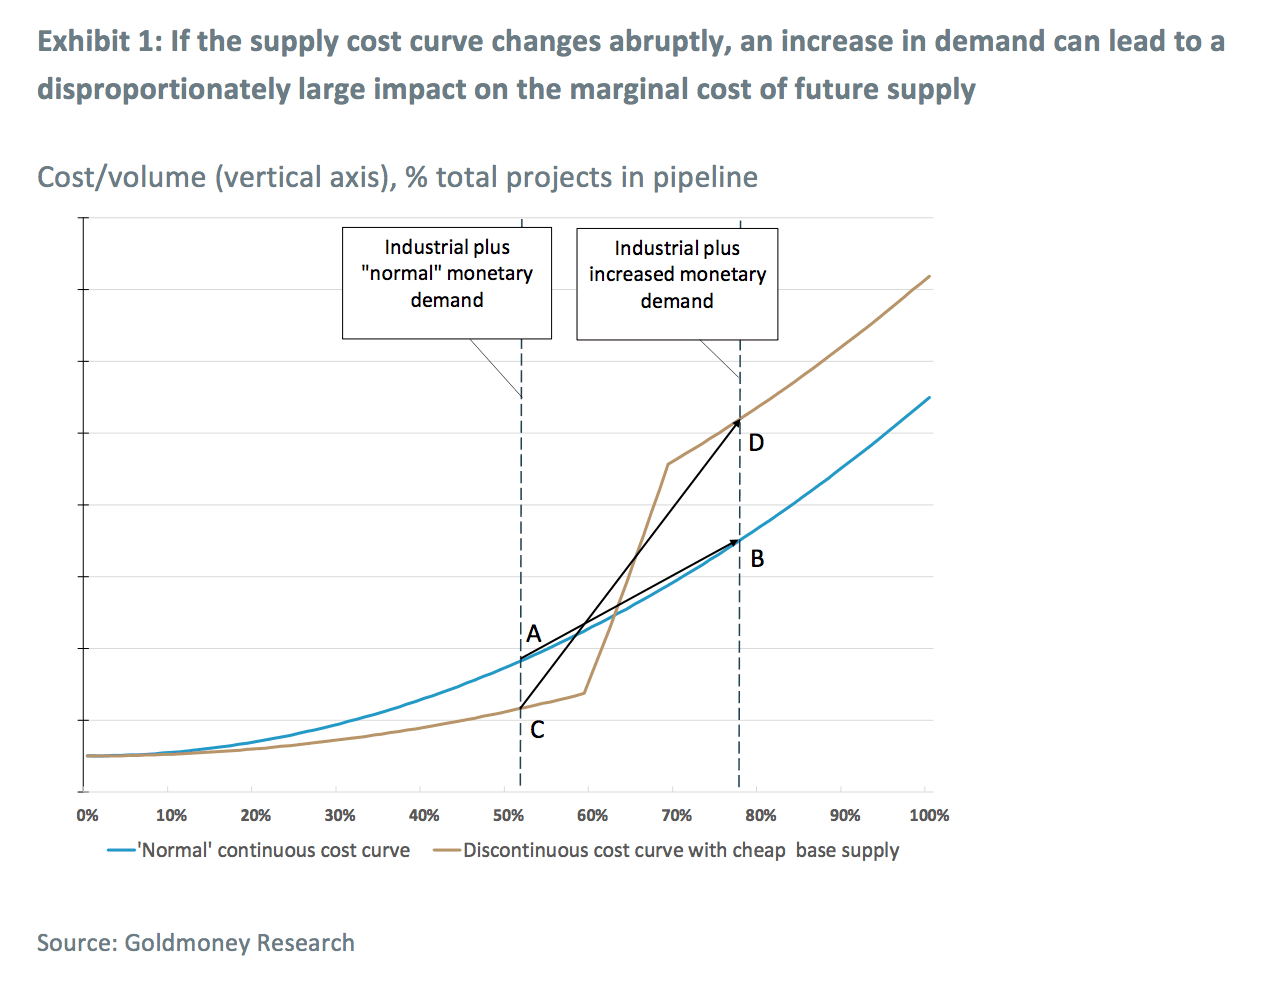
- A large part of global silver production is a by-product of other mining activities such as copper production. This base production is usually enough to meet industrial demand and “normal” monetary demand for silver. Because much silver is mined as a by-product, the silver cost curve has a discontinuous shape, meaning that base production is relatively cheap -- but to meaningfully ramp up supply, much more costly “pure” silver projects need to become economically viable. Hence, when a sharp increase in monetary demand leads to a shift on the cost curve, prices tend to increase sharply. This is illustrated in Exhibit 1. On a smooth continuous supply curve, an increase in expected future demand leads to a shift on the supply cost curve from A to B. However, for silver, the cost curve is different – it has a “kink” (an abrupt, discontinuous change in the first derivative) as a lot of silver is produced as a by-product, meaning it is produced almost regardless of the silver price. As such, small shifts in expected future demand lead only to very small changes in marginal costs. However, a sharp increase in monetary demand for silver leads to a sharp increase in the marginal cost of future supply (C to D), as an increase in future supply can only be achieved by sanctioning high-cost pure silver projects.
Silver prices have peaked in early 2011 at close to US$50.00/ozt and subsequently gradually declined to a low of US$13.70/ozt in late 2015, around the same time when gold prices hit their low. This silver price decline was in line with the findings of our model: Monetary demand for silver slowed down significantly as USD real interest rate expectations (10-year TIPS yields) rose from close to -1% to almost +1% (see Exhibit 2) which tends to be strongly negatively correlated with precious metals prices, silver more so than gold. As we have highlighted before, the decline in gold prices over that time-period was exacerbated due to a repricing in longer-dated energy prices, which has most likely negatively impacted silver prices as well. However, unlike gold – which since then has been on an upward trend and is up 40% from the lows – silver prices have been largely stagnating (see Exhibit 3).

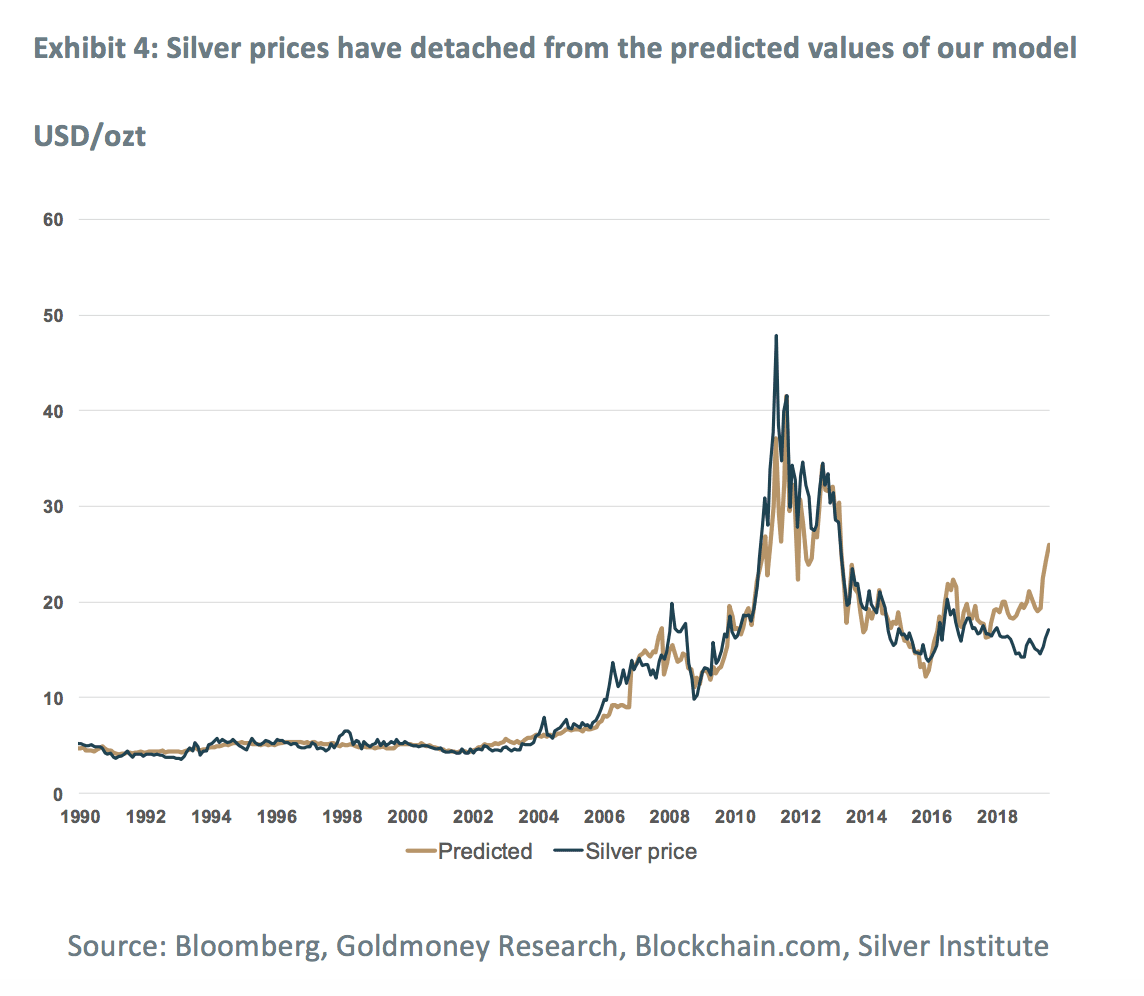
Moreover, silver prices have not just detached from gold, they have detached from the predicted levels in our pricing model as well (see Exhibit 4). Our model predicts that prices should currently be roughly at US$25/ozt – US$8/ozt higher than they are. Importantly, when silver prices bottomed in late 2015, prices were exactly in line with the predicted levels from our model. Subsequently, our model would have predicted prices to rise on the back of slowly declining real-interest rate expectations and a modest growth in industrial output. The decline in real-interest rate expectations did lead to rising gold prices, but silver prices did not follow.
Why is silver lagging?
We believe that the answer is probably two-fold:
First, as we have highlighted before, silver prices are driven both by monetary and industrial demand. This is in contrast to gold prices, which are driven only by monetary demand as industrial demand is small in comparison and fairly stable. In our pricing model, we use industrial production data as a proxy for industrial silver demand. Historically, this has worked fine as the strong fit of our model shows (see Exhibit 4). However, the relationship between overall industrial production and industrial silver demand has dramatically changed over the past years. Historically, the photography sector has accounted for the lion’s share of industrial silver demand. This source demand has almost entirely disappeared by now. In 2018, the photography sector absorbed just under 40 million ounces, down from around 200 million ounces (1/3 of global mine supply) twenty years ago (see Exhibit 5). Strong growth from other sectors (electronics, alloys, ethylene oxide) has been somewhat compensating for the declining demand from the photography industry, but this demand has also peaked around 2013 and is since then slightly down (see Exhibit 5). Fortunately, for the silver industry, one manufacturing sector is increasingly creating demand for silver: the photovoltaic industry. Solar panel manufacturing consumed over 80 million ounces in 2018 (10% of mine supply) and is growing. However, demand from the photovoltaic industry is fairly new, and while rapidly accelerating, it hasn’t been large enough over the past five years to fully compensate for the loss in photography demand and the slowdown in the industrial demand. Hence, on net, industrial demand has been slightly trending down since 2013 (see Exhibit 5). We think lackluster industrial demand over the past years has been a contributor to the weak silver price performance and explains partially why silver has lagged gold.
Importantly, going forward, we do not expect weak industrial demand to pose any more headwinds for silver prices. One reason is that demand from the photography sector cannot get much lower while we expect demand from the photovoltaic industry to continue to rise. Another reason is that - while a decline in industrial demand, even small ones as over the past years, can affect silver prices negatively in a “normal” environment - it becomes secondary in a period of strong monetary demand, as industrial demand is usually weak anyways[1]. 
Second, silver might have been feeling increased competition from cryptocurrencies. Monetary demand for both gold and silver increase when real-interest rate expectations decrease. The reason is that in these environments, people switch from fiat currencies to metal in order to protect purchasing power. For many savers, silver has the advantage that it is easier to purchase in smaller increments (value). Silver also tends to outperform gold in bull markets which makes it more interesting for speculators. Bitcoin may have taken some of silver’s market share with these types of investors. The silver market is also significantly smaller than the gold market. If gold and silver lose the same volume in monetary demand to cryptocurrencies, it should affect silver much more than gold (see Exhibit 6). While gold has moved exactly in line with what our model would predict even as bitcoin prices went from US$300 in late 2015 to currently over US$10,000, silver has underperformed. 
While we don’t make any predictions about the future of cryptocurrencies, we don’t think that competition from cryptocurrencies will impact silver much going forward. The reason why competition from cryptocurrencies may have been able to negatively impact silver over the past years is that the pick-up in monetary demand for precious metals has been modest so far (with the exception of the past few weeks). We expect monetary demand to continue to accelerate while this precious metals bull cycle is gaining speed as the decline in real-rate expectations accelerates. In such an environment, two factors become dominant for silver prices: Low above-ground stocks of silver and the discontinued shape of the silver cost curve.
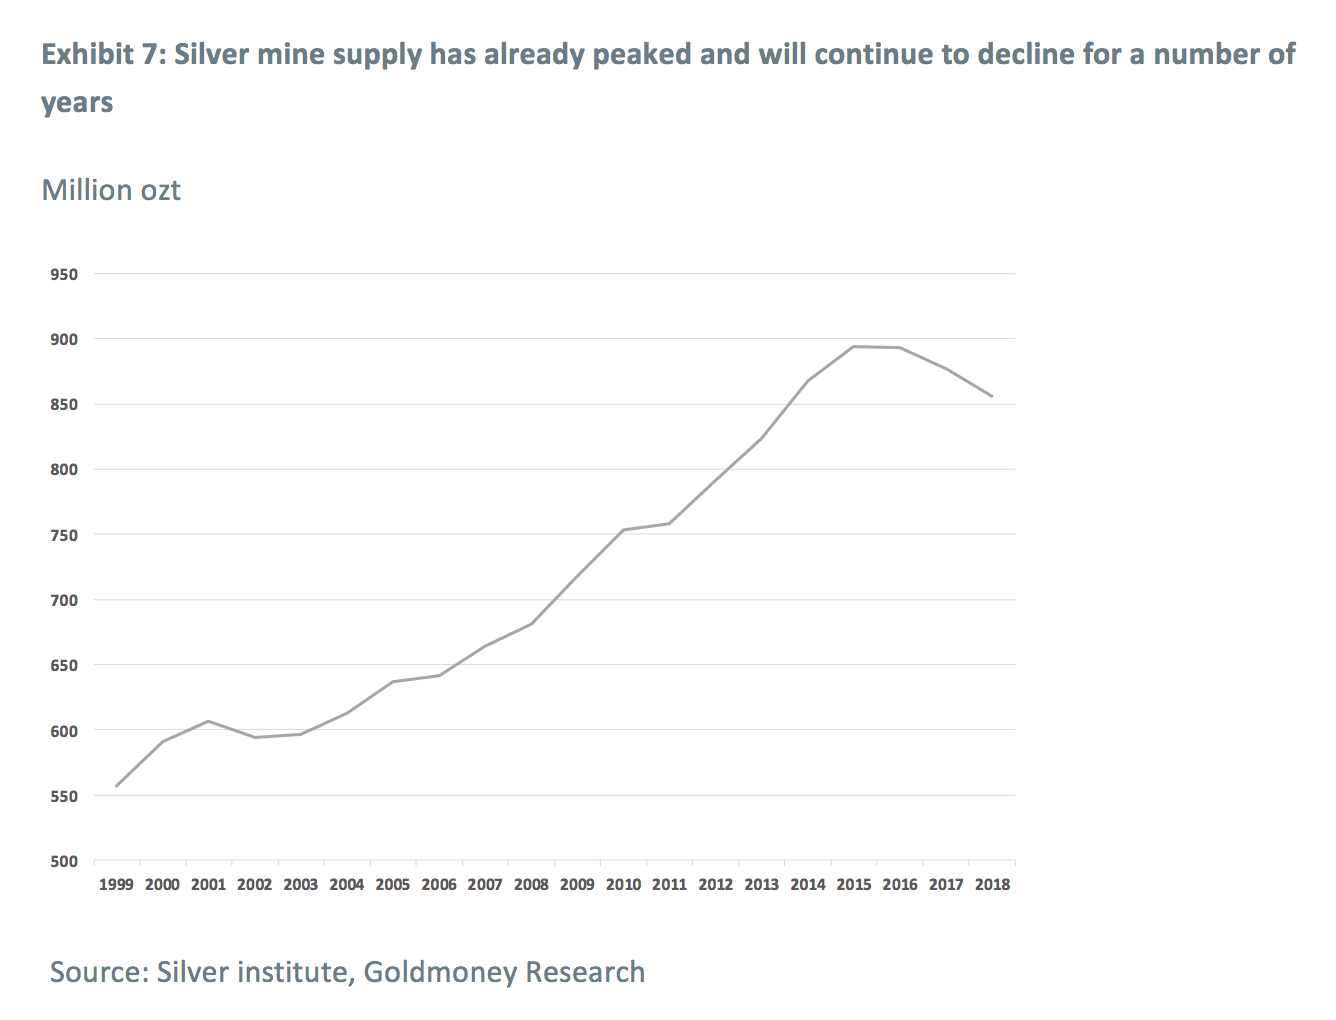
Importantly for the latter, silver mine output is in decline. According to the Silver Institute, silver mine supply has peaked in 2015/2016. Comparing this to the gold mining industry which is poised to enter a period of declining mine supply in the future due to a long period of underinvestment, the silver industry is well ahead in this development, as mine supply already declined 2% in 2018 and the Silver Institute forecasts that it will decline again by 2% this year (see Exhibit 7). There is no change of this trend in sight, and if mine output for base metals suffers from weak demand on the back of an economic recession, silver production as a by-product will decline as well.
On net, we think it’s possible that while the rise of cryptocurrencies did indeed have a negative effect on silver prices over the past years, it was due to the specific environment when it happened. We don’t expect much headwinds to silver going forward.
The gold-to-silver ratio is near an all-time high but we think silver will start to outperform
As a result, silver is currently trading at a ratio to gold of 88, close to the all-time highs in 1991. At the time, silver was trading at US$3.67/ozt. This also marked the interim low in silver prices, which then rallied 1,300% until the peak in 2011 (see Exhibit 8).
Over the past few weeks, silver was finally able to break out. It rallied from US$14/ozt in November last year to US$17/ozt as of today, an increase of 21%. However, silver only performed in line with gold, which rallied from US$1,200/ozt to now over US$1,500/ozt (see Exhibit 9). As we have outlined before, we believe that we are at the beginning of an unfolding gold price cycle and the recent price moves have bolstered out conviction (Gold Price Framework – The next cycle unfolds, June 20, 2009). In such a bullish environment, we expect silver to outperform gold once again. Hence, the recent silver price rally, in our view, is just the start.

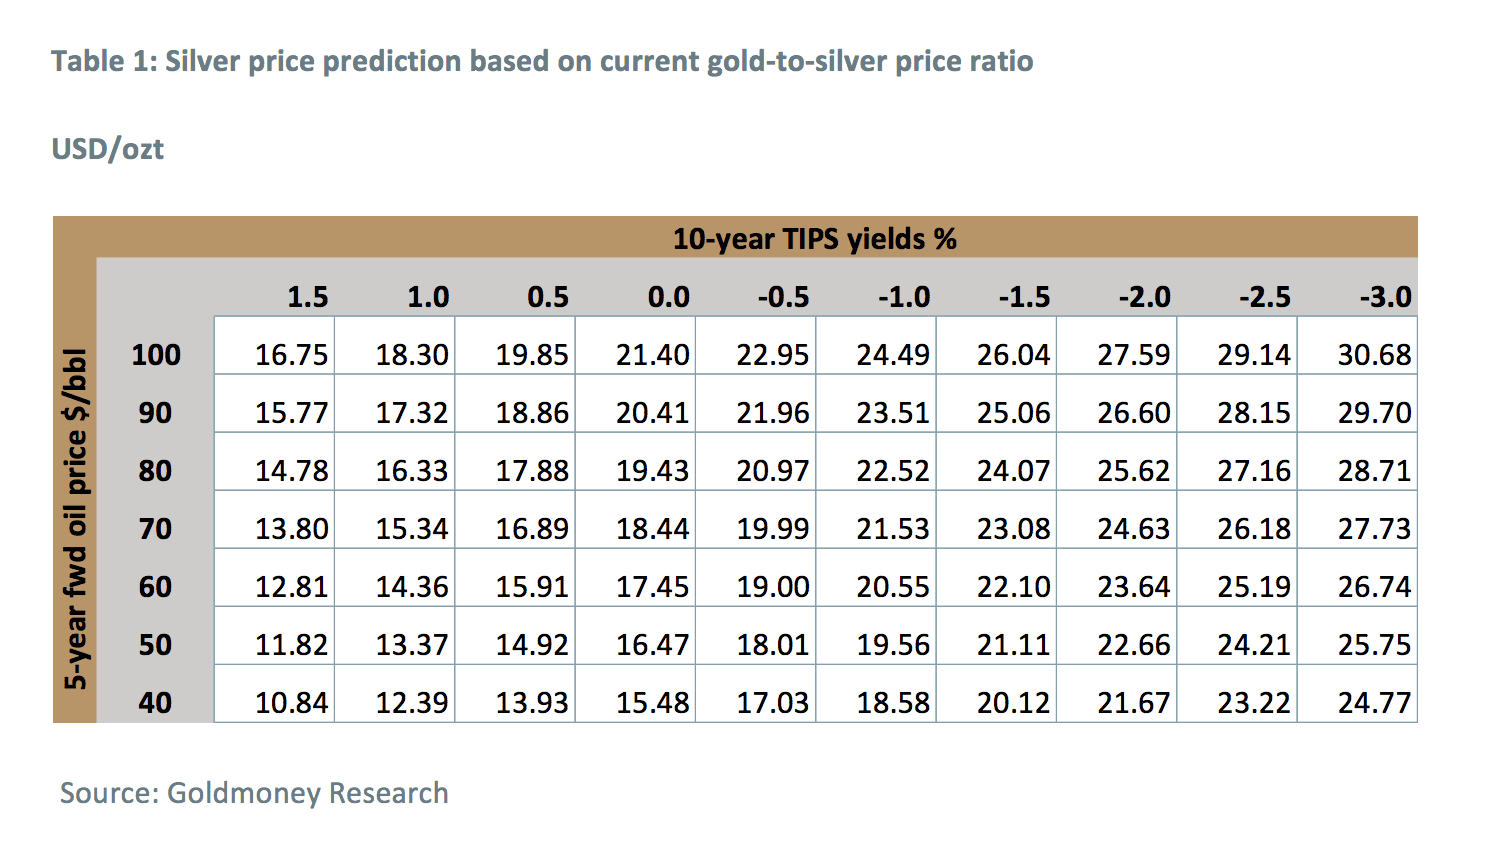
In the gold report mentioned above, we presented a table that shows our gold price predictions for various scenarios of real-interested rate expectations and longer-dated energy prices. The table below takes these predictions and translates them into silver prices, once at current gold-to-silver ratios and at the average ratio over the past 25 years (see table 1 and table 2). If silver prices end up at the latter values, it would once again be in line with the 2:1 silver-to-gold performance we typically experience in precious metals bull cycles. Either way, silver prices have explosive upside potential over the coming years in our view.

[1] Gold and silver bull cycles are driven by declining real-interest rate expectations. Those are usually the result of central bank policy, either through declining nominal interest rates or through rising inflation expectations as a result of monetary policy. Central banks tend to slash rates when economic activity (and thus industrial silver demand) is weak. High inflation tends to negatively impact economic growth.This goes at the end of every post (Updates, Analysis, Insights)
The views and opinions expressed in this article are those of the author(s) and do not reflect those of Goldmoney or Menē, unless expressly stated. Please note that neither Goldmoney, Menē, nor any of its representatives provide financial, legal, tax, investment, or other advice. Such advice should be sought from an independent regulated person or body who is suitably qualified to do so. Any information provided in this article is provided solely as general market commentary and does not constitute advice. Neither Goldmoney nor Menē will accept liability for any loss or damage, which may arise directly or indirectly from your use of or reliance on such information. Goldmoney is a shareholder of Menē, the author a director and shareholder of Goldmoney, and has, therefore, an indirect interest in Menē.