Rate hikes and what it means for gold
Nov 21, 2017·Stefan WielerIt is time to talk about higher rates and what it means for gold
For the first time since the onset of the credit crisis, we believe the market is beginning to price in a higher probability that the Fed is finally in the position to raise rates both continually and more frequently. The prevailing view is that central bank rate hikes are the natural enemy for gold prices. Analyzing rate cycles and the gold price from 1971, we find that gold tends to do better in hiking-cycles than cutting-cycles. We find that the positive performance during hiking-cycles can be explained with the three drivers identified in our gold price framework. Given the outlook for these three drivers, gold will likely do well over the coming quarters even as the Fed keeps raising rates.
View the Entire Research Piece as a PDF here.
In recent years, the Fed has persistently indicated that it was going to hike rates several times per year over the next few years until rates are “normalized”. So far, the Fed has fallen short on delivery, having hiked only once in 2015, once in 2016 and so far twice in 2017. While that doesn’t sound like a lot, compared to its peers, the Fed is a hawk.
- From 2008, the ECB has gradually lowered its base interest rate to zero where it currently remains.
- Similarly, the BoE slashed its base rate to 0.5% in 2009 and lowered it further in 2016 to 0.25%, though it did raise it to 0.5% earlier this month.
- The BoJ policy rates have been languishing near zero since 2009 and dropped below zero (currently -0.1%) two years ago.
- The Reserve Bank of Australia started slashing rates in 2008 from over 7% to currently 1.5%, also the lowest in history.
- The SNB continuously lowered rates since 2008 and slashed them to a staggering -0.75% in 2014, where they have remained ever since.
- While the Bank of Canada managed to hike rates over the past two years, policy rates are still at just 1%, compared to 4.5% in 2008.
However, for the first time since the onset of the credit crisis, we believe the market is beginning to price in a higher probability that the Fed is finally in the position to raise rates continually and more frequently until we are back to a "normal" rate environment. This outlook is increasingly reflected Fed funds futures (see Figure 1).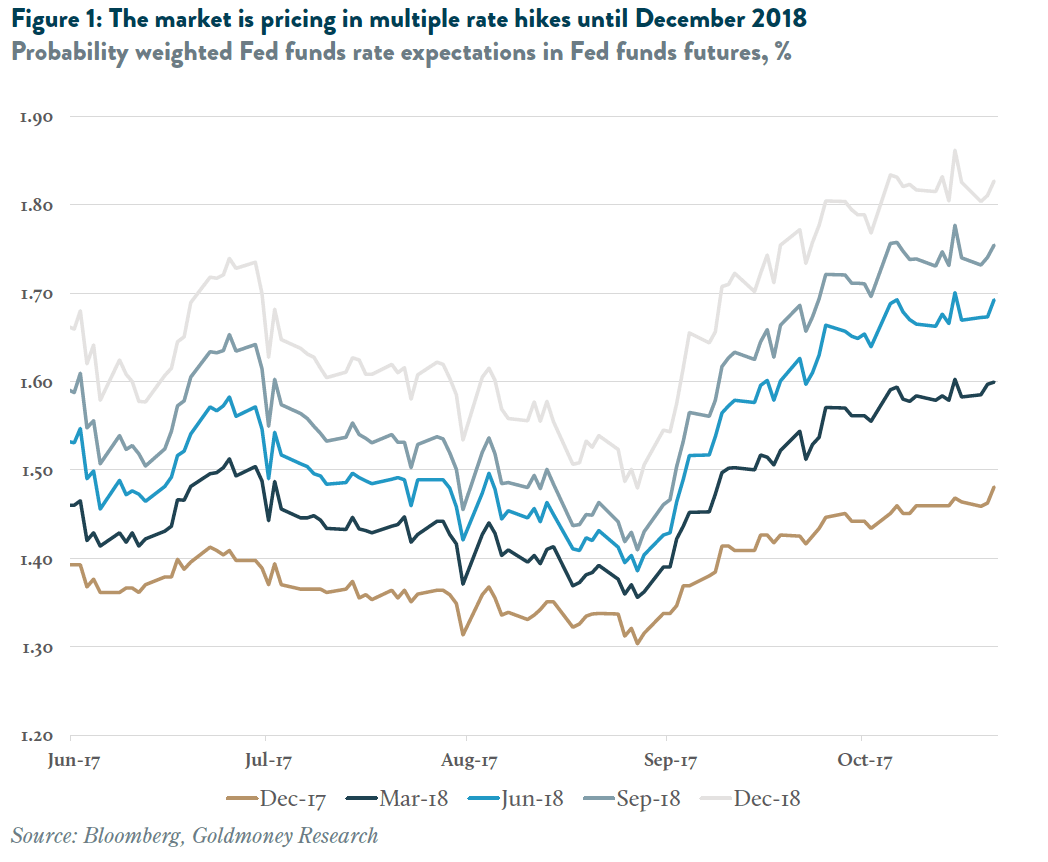
Moreover, such an aggressive1 Fed rate path is unlikely to happen with other central banks continuing to push an accommodative monetary policy as it was the case over the past two years. In our view, the ECB would likely have to react and shift to a more hawkish policy as well, something they would rather avoid.
WHAT DOES THAT MEAN FOR GOLD?
It seems to be the consensus view that central bank rate hikes are the natural enemy for gold prices. Higher rates, so the argument goes, would diminish the incentive for investors to hold gold as gold “pays no interest”, which then in turn should lead to lower gold prices. This view is not only just too simplistic in our view, it is also inconsistent with historical performance.
First, gold does pay interest, if it is lent out (the interest rate on gold is called the gold lease rate). The same logic applies to fiat currency. A USD100 bill pays no interest either. In order to generate interest, fiat currency has to be lent out, which can be done by putting it into a bank savings account (effectively lending the money to the bank and becoming a creditor).
Second, and this is the much more important point, interest rates alone are only small piece of the puzzle when it comes to the drivers for gold prices. In our gold price framework piece (see Gold Price Framework Vol. 1: Price Model, October 8, 2015), we identify three main drivers for the gold price: Central bank policy, longer dated energy prices and changes in central bank gold holdings. Interest rates play a crucial role in the first category. But it is not nominal rates that drive the price, but real-interest rates.2 Consequently, even when nominal interest rates rise, gold prices are not necessarily negatively affected. In fact, if inflation expectations rise more than expectations for nominal rates, changes in real interest rates would even be a positive driver for gold prices. We have seen this effect to the extreme in the late 1970s and early 1980s when the Fed relentlessly raised rates to double digits, but inflation was high and rising, and as the market continued to price in years of ongoing double-digit inflation, gold prices kept rallying (see Figure 2). Only when the Fed, under Chairman Volker, decided to break the inflation cycle by ramping up rates to nearly 20%, inflation started to slow down. Real interest rate expectations subsequently increased and gold prices eventually declined. But even as gold prices receded almost 50% from the highs in the early 1980s, they ended up >800% higher than where they were at the beginning of the cycle.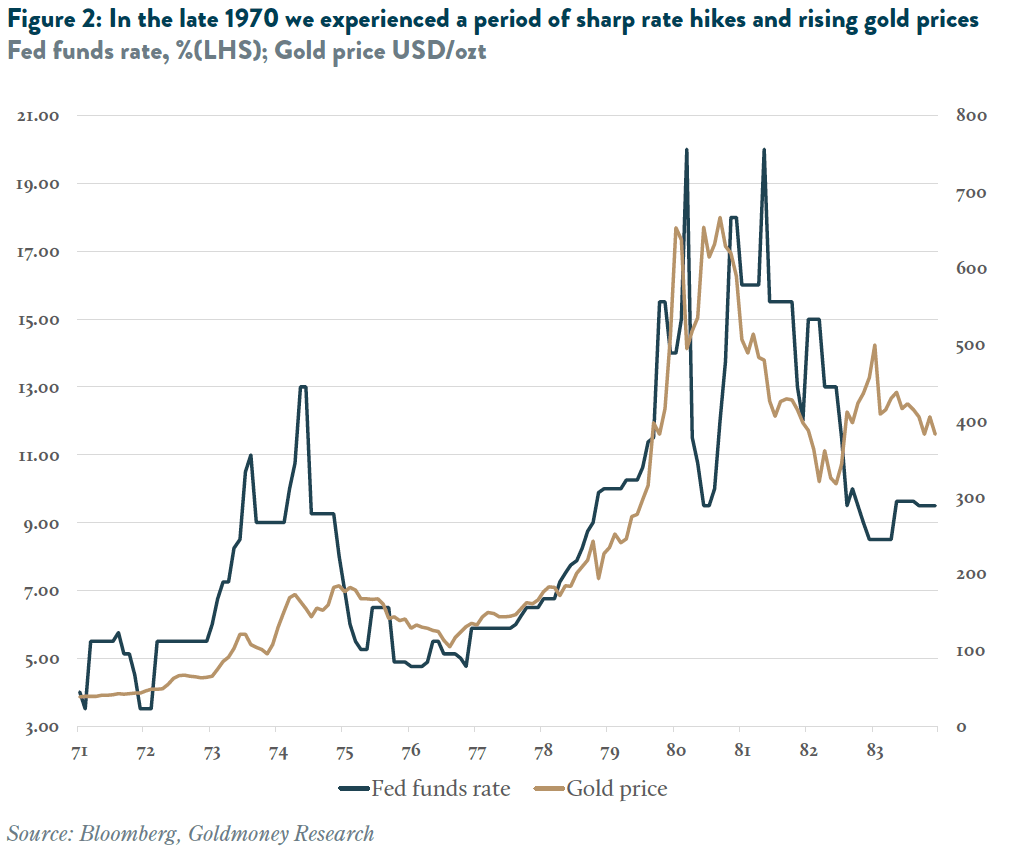
GOLD PERFORMANCE IN INTEREST RATE CYCLES
To get a better understanding how gold performs in different interest rate environments, we analyzed performance of gold in USD over the 46 year period since the demonization of gold in 1971. In a first step, we divided this entire time-period into hiking-cycles and cutting-cycles, where a new cycle starts every time a change in the fed funds rate occurs that has the opposite sign of the most recent change. For example, the most recent cuting-cycle began in September 2007 when the Fed lowered the Fed funds rate to 4.75% from previously 5.25%. The Fed then kept on lowering rates until December 2008 when the Fed funds rate hit 0.25% where it remained for seven years. In December 2015, the Fed raised rates again for the first time, which is when the cutting-cycle ended and the new hiking-cycle began. Using this methodology, we identified 23 hiking- and 23 cutting-cycles since 1971 (see Figure 3).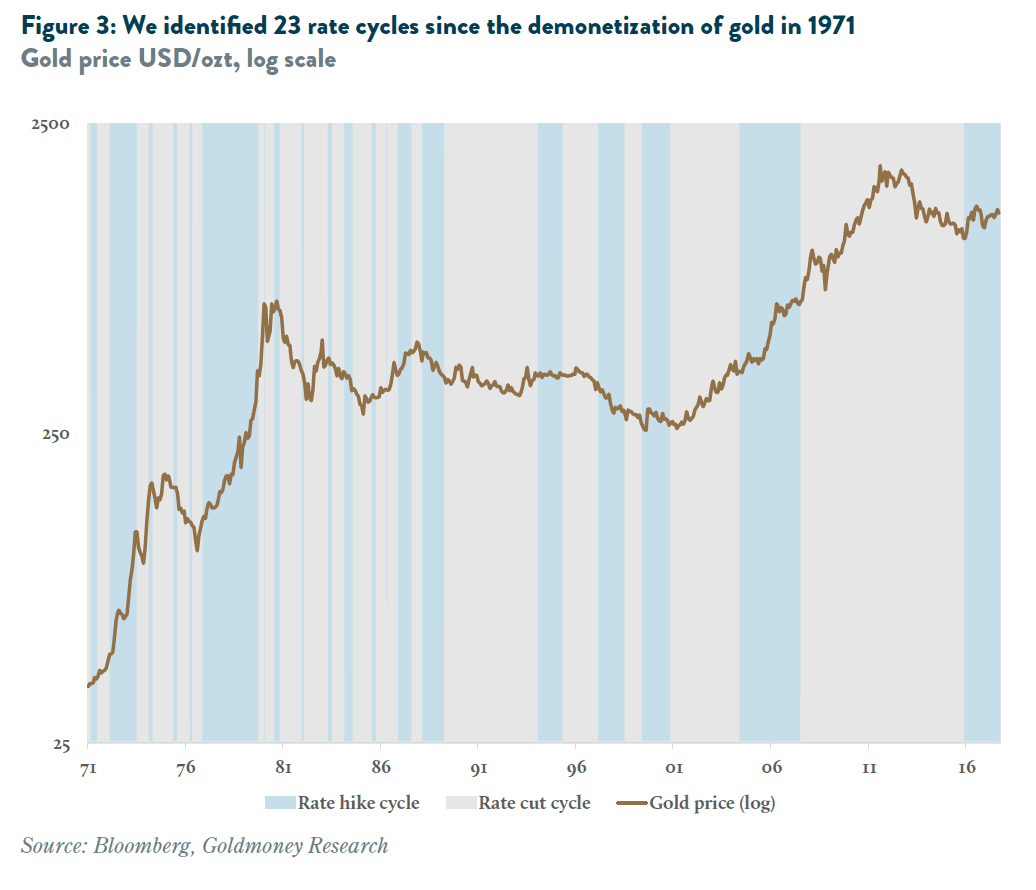
On average, hiking-cycles lasted 10 months while cutting-cycles lasted 14 months. We find that gold performed equally well in both hiking- and cutting-cycles with an average annualized performance of 7.80% (see Table 1). One can argue that the strong average gold price performance during hiking-cycles is skewed to the upside by the high-inflation, high-interest rate period of the 1970-1980s which we highlighted above. But even if we exclude this period and start measuring from 19903, gold did even better during periods of rising rates with an annualized performance of around 4.85% in hiking-cycles vs. 4.0% during cutting-cycles.
Moreover, if we just slightly shift the way we measure the performance by including the performance of the month in which the Fed changes direction to the previous cycle4, things look even better for rate hike environments. Measured this way, gold had an average annualized return of 9.1% in hiking-cycles vs. just 6.8% in cutting-cycles. Measuring the performance this way from 1990 onwards showed a 7.23% return during hike-cycles and 2.55% during cut-cycles.
We also analyzed how gold performed in the months where the rate change occurred. We identified 98 rate hikes and 91 rate cuts since 1971. On average, months with a rate hike showed an annualized gold price performance of 15.4% vs an average 8.3% for months with a rate cut. And when measured from 1990, hike months have yielded an average return of 8.1% while cut months only one of 4.5%.
We then did the same analysis measuring gold’s performance for the months following a rate change rather than the month of the change itself. In this case, gold increased by 15.0% on average on an annualized basis after the Fed cut rates, and 16.7% after a hike. And measured only from 1990, gold had an average annualised increase of 22.7% after a hike month, while it “only” rallied 14.5% after cut months.
On net, we can conclude that rate hikes – contrary to common beliefs – don’t normally impact the gold price negatively at all. In fact, historically gold has done better during and immediately after both specific rate hikes and hiking-cycles than during and after rate cuts and cutting-cycles.
IN DEPTH ANALYSIS
In order to better understand why gold prices - contrary to common belief – tend not to be depressed by rising rates, we analyzed the 10 cycles since 1992.5 Using our proprietary gold price framework, we attributed the change in price to the three main drivers we identified in our model: Central bank policy (real interest rates/QE), longer dated energy prices and changes in central bank gold holdings. In the five hiking cycles, gold prices were down in one instance, essentially flat in two and up substantially in the remaining two (see Table 2).
HIKING CYCLES WITH FLAT GOLD PRICE PERFORMANCE
The first hike cycle with flat gold price performance that we analyzed started in February 1994 and lasted until June 1995. During that period, the Fed raised the Fed funds rate from 3% to 6%. However, real-interest rate expectations remained stable around 3.6%.6 Longer-dated energy prices, as measured by the 5-year forward price of Brent, also remained stable (between USD16.86/bbl to USD17.11/bbl) and central banks globally neither added nor sold any significant quantity of gold. They key in this cycle thus was that real interest rate expectations did not materially go up, despite a relatively quick rise in nominal rates by 3%.
The second hike-cycle with flat gold price performance started in June 1999 and ended in December 2000. During that time, the Fed raised rates from 4.75% to 6.5%. Gold increased slightly from USD262/ozt to USD272/ozt. Despite the hike in nominal rates, real-interest rate expectations decreased during that period from 3.91% to 3.30%, meaning the real-interest rate environment was positive for gold. Also, longer-dated energy prices increased slightly from USD17.92/bbl to USD18.57/bbl. However, these tailwinds from real interest rate expectations and energy prices were offset by net gold sales from central banks of 530 tonnes during that period, which resulted in the net flat gold price performance.
HIKING CYCLE WITH NEGATIVE GOLD PRICE PERFORMANCE
Between March 1997 and August 1998, the Fed hiked rates from 5% to 5.25%. Gold prices declined 24% during that period from USD363/ozt to USD276/ozt. Real-interest rate expectations fell during that period from 4.43% to 3.42% but this positive gold price driver was offset by a decline in longer dated energy prices from USD19.15/bbl to USD17.05/bbl, and central banks selling 156 tonnes of gold. Overall, our model would have predicted such an environment to be neutral to very slightly positive for the gold price. Thus, our model does not predict this realized price decline very well. However, we find that if we add one more variable to the model, the model is able to predict this brief period more accurately. That variable is the Asia USD index. Spring 1997 marks the onset of the Asian crisis that began in Thailand and quickly spread across the region, impacting Asian economies, currencies (hence the collapse in the Asia USD index) and eventually the buying power of the people living in these countries, which have traditionally been large buyers of gold. Hence, we believe that absent this singular event, gold prices returns would probably have been flat or even positive during this particular hiking-cycle as well.
HIKING CYCLES WITH POSITIVE GOLD PRICE PERFORMANCE
The first hiking-cycle with positive gold price performance that we analyzed started in June 2004 and ended in September 2007. During that time, gold prices went from USD396/ozt to USD744/ozt, an increase of 88%, all while the Fed hiked rates from 1% to 5.25%. Importantly, real-interest rates increased only marginally, from 2.15% to 2.26%. At the same time, central banks sold nearly 1550 tons of gold, which had a negative impact on the price by around USD45/ozt, according to our model. What drove the gold price rally was the sharp price increase in longer-dated energy prices from USD26.50/bbl to USD71.50, an increase of 270%. According to our model parameters, this translated into a gold price increase of USD375/ozt.
The second gold price rally in a rising interest rate environment started in December 2015 as the Fed departed from eight years of near-zero interest rates and increased rates by 25bps. Two more hikes followed since, lifting the Fed funds upper target rate to 1.25% where it currently stands. During that time, gold prices rallied 19%. This time it was a combination of all three drivers that pushed prices higher: TIPS yields declined from 0.75% to currently 0.45% and while the Fed is no longer increasing its asset holdings, the ECB, BoJ, BoE and SNB resumed and accelerated their respective asset purchase programs. Longer-dated oil prices rose from USD56.30/bbl to USD58.30/bbl and central banks added 930 tonnes of gold.
CONCLUSIONS
On net, we find that central bank rate hike cycles don’t automatically translate to gold bear markets. Quite the contrary: historically, gold prices have done better on average when the Fed was hiking rather than cutting rates. Gold has managed to rise in hiking-cycles when one or more of the price drivers we have identified (real interest rates, long-dated energy and central bank net purchases) created strong tailwinds for gold, countering any potential headwinds from rising nominal policy rates. Looking at these three drivers, we don’t see much reason why gold prices should decline for the remainder of the current hiking-cycle either.
As we have outlined before in detail (see Gold is breaking free from Fed rate expectations, 20 March 2017), real interest-rate expectations are unlikely to increase much from current levels. In fact, given the Fed’s own assessment of where terminal rates will end up, the most bullish scenario (for real interest rates) would be one where TIPS yields increase by 0.5% to 1%. For that to happen, the Fed would have to be able to continually raise rates for three more years without triggering a recession, making this the longest recession-free period in US history. The more bearish (and in our view more likely) scenario is that the US economy will encounter a recession along the way, forcing the Fed to cut rates to zero again and – because there is not enough room to cut rates by the average 5% that is typical in a recession - launching another round of unconventional monetary policy to resume growing its balance sheet.
Similarly, longer-dated energy prices have little downside from here and much more upside over the long run. Spot oil prices have rallied sharply in recent weeks as the overhang in global petroleum inventories is finally drawing down. But longer dated prices have remained fairly stable around USD55-60/bbl, the low end of what we think is needed to encourage new investments in production, and to replace depleted sources to secure future supply over the long run. And that is without taking inflation into account. Further, we expect that central banks remain net buyers of gold for the foreseeable future. Central banks in the western hemisphere largely stopped selling gold a few years ago while emerging market central banks keep adding metal, particularly China and Russia, but others as well.
Taking all this into account, this likely means that the downside risks to gold are limited in the current hiking-cycle. Similarly, absent an acceleration in inflation we also don’t see a near-term catalyst for a sharp rally either, but over the long run the risks are clearly skewed to the upside in our view.
FAQs
WHAT IS INFLATION?
The original definition of inflation is an increase in the amount of money in circulation. Today the term inflation is mostly used to refer to the rate at which the price level, however defined, is rising. For example, a good that costs $100 today and $110 a year later experienced inflation of 10%. When referring to the original meaning, economists therefore often use the term ‘monetary inflation’ to distinguish from ‘price inflation’. Economists create weighted baskets of goods and services to estimate overall consumer price inflation. For example, the consumer price index (CPI) reflects the price development of a basket of goods and services that aims at replicating the typical consumer’s cost of living.
WHAT IS THE CURRENT INFLATION RATE?
There is no straightforward answer for this. Price inflation can be estimated in many different ways. The two most widely accepted price inflation indices are PCE (personal consumption expenditure) and CPI (consumer price index). The former is used by the Federal Reserve when setting US monetary policy and the latter applies to cost of living adjustments for US Social Security and certain other federal government benefits. We find that CPI inflation expectations have been a key driver for gold prices. CPI inflation also usually tends to be higher than PCE inflation. CPI (urban consumers) inflation in October 2017 came in at 2.0% year-over-year up from 1.6% a year ago.
WHAT IS THE NOMINAL INTEREST RATE?
Nominal interest rates are simply the interest paid on an investment in percentage terms. For example, a bond that sold for $100 and pays a $2 coupon per annum has a 2% interest rate. However, the value of a bond deviates from its face value over time when overall interest rates change. When interest rates decline, (all else equal) the bond above would increase in value as it now pays a higher interest than bonds that are issued today. Therefore, in financial markets one would usually refer to the yield of a bond—which is simply the return on the bond(coupon / price)—for comparison purposes. If the bond is trading at par (price is the same as the face value), the interest rate and the yield are the same. What makes things more complicated is that the two terms are often used interchangeably. In that case, the term interest rate is usually used to describe the yield of a fixed income instrument. Most people are not active investors in bonds (although they might be via their pension funds) and know interest rates only from their bank account. The interest paid on a savings account is equivalent to its yield and is a nominal interest rate.
WHAT IS THE REAL INTEREST RATE?
In contrast to nominal interest rates, real interest rates also take the level of price inflation into account. Broadly speaking, real interest rates = nominal interest rates + price inflation. Hence real interest rates measure the return on an investment in actual purchasing power. Why do real interest rates matter? For example, when interest rates are at 5% p.a. but inflation is 10% p.a. , after one year the lender has earned 5% in nominal terms, but he actually has lost value. More specifically, with an initial investment of $100 he would end up with $105 after one year. But those $105 would only buy him 95% of the goods and services the original $100 bought a year ago. Thus when price inflation is higher than the nominal interest rate on savings accounts, savers are de facto paying to lend out their money to the bank. Currently the national average money market account rate is 0.2% while inflation is 2.0%, hence savers lose 1.8% of their purchasing power per year if price inflation stays at this level.
WHAT IS THE FED?
The Fed is short for the US Federal Reserve, which was established in 1913 by the US Congress. The Fed is headed by the Board of Governors of the Federal Reserve, consisting of 7 presidential appointees serving 14 year terms. It’s most important body however is the Federal Open Market Committee (FOMC). The Current chairwoman of the Fed and FOMC is Janet Yellen.
The Fed has several functions. It acts as the lender of last resort to financial institutions that temporarily lose access to the capital markets in a crisis. It exerts other banking functions such clearing the transfer of funds from one bank to another. It also acts as the US government’s bank and sells and redeems government securities. However, what receives the most attention is that the Fed determines monetary policy, that is, the level of nominal interest rates. The monetary policy decisions of the Fed, such as setting interest rates, are made by the FOMC.
WHAT IS THE FOMC?
There are 12 voting members of the FOMC: the seven members of the Board of Governors, the president of the Federal Reserve Bank of New York and the presidents of four other regional Reserve Banks (on a one-year rotating basis). There are eight scheduled FOMC meetings per year. When the FOMC sets interest rates, it actually sets the lower and upper bounds of the federal funds rate, the rate at which banks either lend out or borrow reserves in order to meet statutory reserve requirements.
WHAT IS THE FEDERAL FUNDS RATE?
The federal funds rate is the overnight interest rate at which a depository institution (a bank) lends funds to another depository institution. The Fed only sets a target band; the banks can in theory charge each other what they want. However, in practice the rate at which banks lend to each other is always within this band. The Fed uses open market operations to ensure that the fed funds rate stays within the target band. This means that it buys and sells securities (normally US Treasuries) from its member banks and replaces them with Federal Reserve credit. The upper band is called the discount rate. Even though the Fed prefers that banks to borrow from each other, the fed funds rate should in theory not be able to exceed the discount rate as otherwise the banks may simply borrow directly from the Fed itself. What makes the fed funds rate so important is that it necessarily influences all other interest rates as well. Hence by setting the fed funds rate target, the Fed is able to influence credit conditions throughout the economy.
WHAT IS FORWARD GUIDANCE?
At the end of an FOMC meeting, the Fed announces its outcome and releases a statement that aims to provide the public with information about the FOMC members’ views in regards to current macroeconomic conditions as well as their expectations thereof. Among other data, the Fed publishes a so called dotplot which shows where the FOMC members believe the Fed funds rate will be at the end of each year for the next few years and over the long run. The median projection is regarded as the Feds forward guidance for the interest rate path. Often the market is more interested in the Feds forward guidance than in the most recent monetary policy decision itself. For example, when the Fed announced its third rate hike in 11 years on March 15, 2017, the market reaction implied that the Fed had become more dovish rather than hawkish. The reason for this was that the Fed left its interest rate projections largely unchanged while the marked had expected the adoption of a more hawkish outlook.
WILL THE FED RAISE INTEREST RATES?
At the moment it seems likely that the Fed will continue to raise rates. Since the Fed began to depart from zero interest rates in December 2015 it has raised rates three times by 25bps (0.25%) each. According to the Fed’s own dotplot forecasts the Fed is anticipating raising rates to 2.85% by the end of 2020. However, the market is not expecting the Fed to be able to raise rates as quickly as the Fed’s forward guidance suggests.
WILL REAL INTEREST RATES RISE?
Unlikely. We believe the Fed will only continue to raise nominal interest rates as long as the US economy keeps expanding and inflation remains above the 2% target. This suggests that at the end of the current hiking cycle, realized real interest rates will not exceed 1%. However, we are currently already in the second longest period of economic expansion in US history. Should the US economy slow down or even fall into recession, the Fed would more probably have to cut rates rather than raise rates, in our view. We would expect real-interest rates to go sharply lower in such a scenario.
1 Compared to historical rate hike cycles, the Feds forward guidance still points to an extremely slow increase in rates, adding less than 2% over 3 years. However, relative to the Fed policy over the past few years, this appears aggressive
2 More accurately, expectations for real interest rates as measured in Treasury Inflation Protected Securities (TIPS) yields.
3 By 1990, Inflation had declined to 4.5% and Fed funds rates had fallen to slightly over 8% and the were in a falling trend.
4 On average, FOMC meetings tend to be in the latter half of the month. With our original method, we ignore the changes in the gold price from the first day of the month of the meeting up to the day of the announcement. With this alternative method, this period is included. Unfortunately, it also includes the period from the rate change announcement until the end of that respective month, which is already part of the new cycle. However, both methods show that gold prices do equally good or better in hiking-cycles, indicating that despite the deficiencies of either method, the conclusions we draw are valid.
5 We chose this date due to the availability of longer-dated energy prices (5-year forward Brent)
6 There is no trading data for TIPS yields prior to 1997. For the period prior to 1997, we use implied real interest rate data derived from 10-year treasury yields, University of Michigan Inflation expectations and the VIX, which historically had a very close fit with actual TIPS yields.
The views and opinions expressed in this article are those of the author(s) and do not reflect those of Goldmoney, unless expressly stated. The article is for general information purposes only and does not constitute either Goldmoney or the author(s) providing you with legal, financial, tax, investment, or accounting advice. You should not act or rely on any information contained in the article without first seeking independent professional advice. Care has been taken to ensure that the information in the article is reliable; however, Goldmoney does not represent that it is accurate, complete, up-to-date and/or to be taken as an indication of future results and it should not be relied upon as such. Goldmoney will not be held responsible for any claim, loss, damage, or inconvenience caused as a result of any information or opinion contained in this article and any action taken as a result of the opinions and information contained in this article is at your own risk.