Oil markets predicting risk of a global recession
Mar 2, 2020·Goldmoney InsightsOil prices have sold off sharply over the past month. Despite a series of bullish events – the US airstrike targetting Qasem Soleimani, Iran’s retaliation attack on US troops in Iraq, the shutdown of almost the entire Libyan production and the US’ tightening the screws on Venezuela by sanctioning Rosneft and potentially refusing to renew waivers to US companies stating in April - oil prices are now substantially lower than before these events. Brent front month prices peaked at $72/bbl in early January and are now at below $50/bbl (See Exhibit 1).

Moreover, by mid-January, the geopolitical tensions and supply losses had pushed the Brent curve into severe backwardation. June-December 2020 time-spreads for example traded as high as $4.50/bbl just one month ago, reflecting prolonged physical tightness. Those time-spreads are now in contango (see Exhibit 2).

This massive change in sentiment happened as the Coronavirus situation in China unfolded. Importantly, while we do expect a significant impact on Chinese oil demand from the massive travel restrictions in China, that alone would not warrant such a move in the curve in our view. Instead, we think the recent moves in oil prices is reflecting expectations for a significant slowdown in global economic growth. In fact, we think the oil price move is now pricing in a significant probability for a global recession in 2020.
Commodity markets are the only markets which currently reflecting this view. Equity markets, despite the recent sell-off, do not. Importantly, we believe commodity markets are still underpricing the risks to aggregate demand. The question is not longer whether the economic impact from the Coronavirus outbreak will be short-lived or whether it will be more pronounced. The question is whether the economic impact will be pronounced or catastrophic. In our view, energy markets are currently pricing in a pronounced impact with substantial fiscal and monetary stimulus down the road. There is substantial downside risk if that view turns out to be too optimistic.
That said, in either case we expect central banks to return to the 2008 playbook soon. Nominal interest rates will only decline from here and we are likely going to see a reacceleration in quantitative easing. However, in the catastrophic scenario, we believe central banks will quickly realize that the tools they have been using since 2008 will not get them very far this time. Hence, we would expect central banks to become more creative, by deploying something like “helicopter money”. This is not far-fetched. Hong Kong announced a few days ago that it would give every adult citizen HK$10’000, around $1300, in order to combat the economic fallout Coronavirus-crisis. We believe this would push gold prices sharply higher medium term.
How the Coronavirus outbreak changed the oil market outlook
As we have highlighted before, there is a strong correlation between inventories and time-spreads (see Exhibit 3). When inventories are low, the oil curve tends to trade in backwardation (near-dated prices are above deferred prices). When inventories are high, the curve is in contango (near-dated prices are below deferred prices). The reason for this is that when inventories are low, consumers of a commodity are willing to pay a premium for immediate delivery rather than delivery at some point in the future. If oil (or any other commodity) is an input good in the production process, running out of the input good is much more costly than paying the premium as the alternative would be to shut down production. For example, jet fuel is an input good for an airline. Running out of jet fuel is very costly, hence, when inventories are generally low, airlines are willing to pay more for immediate jet fuel deliveries. The curve becomes backwardated. Conversely, when inventories are high, there is no risk of running out of oil, and storing oil is expensive (storage costs, insurance costs, time value of money), hence, consumers would rather have delivery in the future, and the curve is in contango.

The outlook at the end of 2019
We ended 2019 with relatively low global petroleum inventories, and hence, the Brent curve was backwardated. The low inventory situation came amidst strong US shale production growth and weak global demand. The reason for this is that OPEC production was lower by close to 2mb/d year-over-year on both voluntary (core OPEC+) and involuntary (Iran, Venezuela) production cuts (see Exhibit 4).

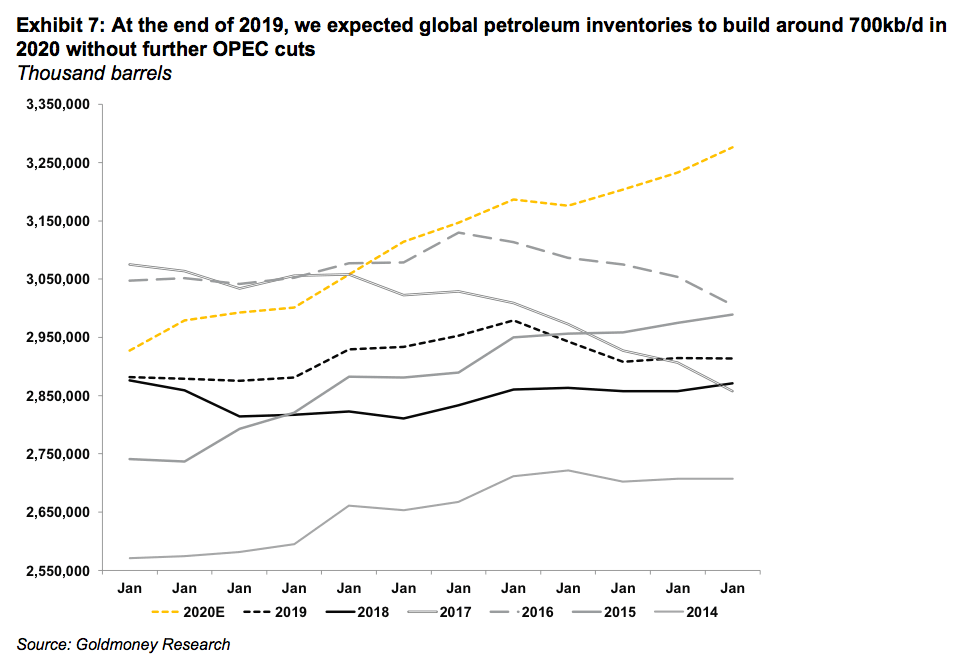
However, we expected global balances to change going forward. By the end of 2019, we predicted the global oil balance to be oversupplied by roughly 0.7mb/d in 2020 and by about 1mb/d in 1H2020. Consequently, we expected the curve to become less backwardated and eventually to end up in contango, accompanied by lower front month prices.
Our bearish 2020 balance was driven mostly by strong production forecasts:
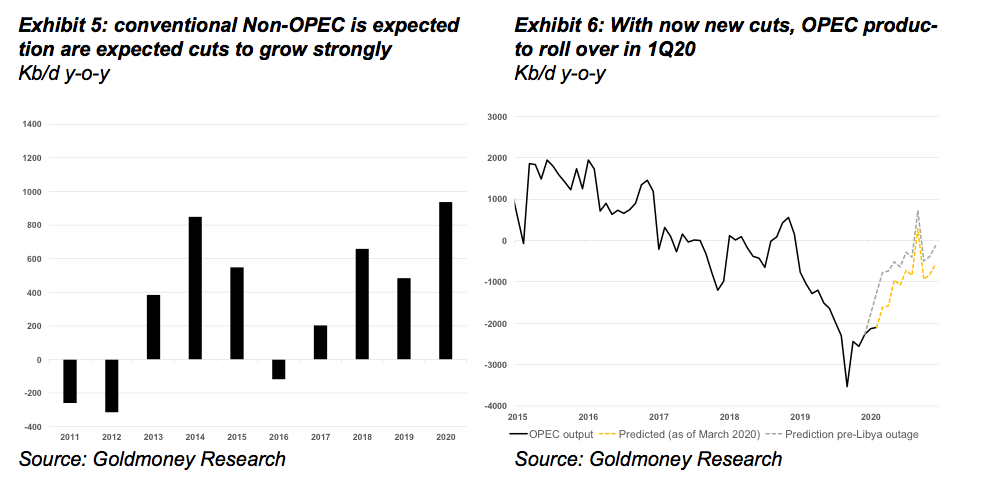
- Conventional non-OPEC production was (and still is) expected to grow strongly in 2020 by about 1 mb/d with several major new fields coming online and ramping up.
- US shale production, while not growing as quickly as in 2019, was still expected to grow at around 1mb/d (including natural gas liquids NGLs).
- On net, we expected non-OPEC production to grow by 2mb/d year-over-year
- This strong growth was expected to offset declines of 0.5mb/d year-over-year in OPEC production on the back of the new production cuts decided in December 2019 plus reduced output from Libya (we assume not all Libyan production will remain offline in 2020). The voluntary and involuntary production cuts from early 2019, however, would no longer show up as year-over-year declines.
On net, at the end of 2019 we expected global oil production to grow by around 1.6mb/d in 2020.
These supply growth expectations exceeded demand growth expectations in 2020. Most forecasters, including the International Energy Agency (IEA), predicted demand growth at slightly over 1mb/d. This reflected an expected recovery in global economic growth from 3% in 2019 to 3.4% in 2020. We had a more pessimistic outlook on demand growth of around 800-900kb/d because our calculation showed that demand growth was slowing down sharply in 2H2019, and thus, a minor recovery in economic growth would unlikely lead to the demand growth figures we had been accustomed to over the past years. But even with the more optimistic outlook by the IEA, the global oil balance was poised to be oversupplied.
On net, we expected global petroleum inventories to build by close to 700kb/d in 2020 or about 230 million barrels. The bearish balances where mostly in 1H20 with an oversupply of >1mb/d, while it looked more neutral for the remainder of the year. Our inventory forecast, thus, implied weaker time-spreads and consequently, lower prices in 1H2020.
Shutting off Libyan exports
However, this bearish outlook was suddenly challenged in early January. Firstly, it was reported that Qasem Soleimani, an Iranian General of the revolutionary guards and commander of its Quds Force, was killed in an US airstrike in Iraq. Soleimani was considered the second most powerful man in Iran, in charge of all military operations outside Iran. The news sent oil prices sharply higher as the market began to worry about an escalation of this conflict in the region. Iran had repeatedly threatened to disrupt oil shipments in the Strait of Hormuz, through which about 1/3 of all seaborne oil flows. A few days later, Iran attacked a US base in Iraq with missiles in retribution. The US quickly announced that there weren’t any casualties among the US troops. The market interpreted that the Iranian retribution was an act of saving face rather than the first strike in a prolonged conflict, and prices moved sharply lower on the same day (see Exhibit 8). As suddenly as this conflict emerged, as quickly it was over, without any real impact on oil supplies.

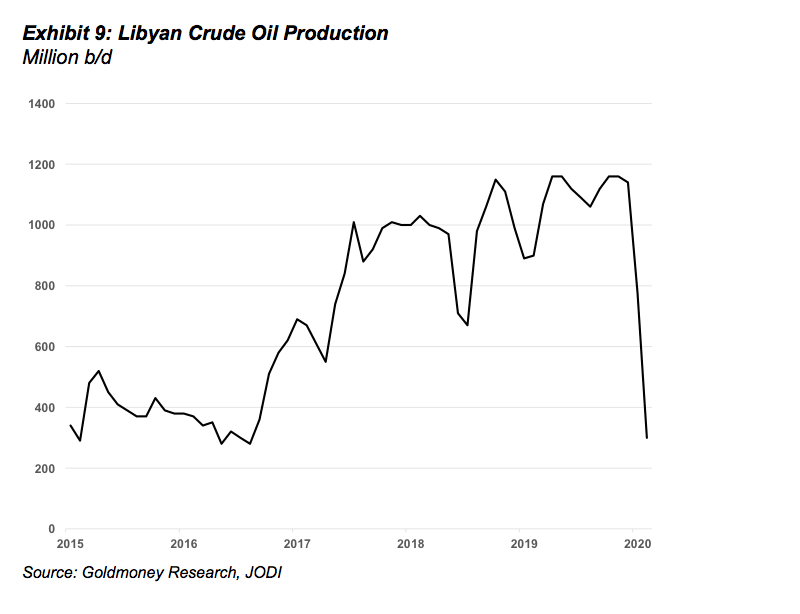
This changed quickly when on January 17, 2020, forces close to Libyan General Haftar closed almost all of Libya’s export ports. Prior to that, Libya had produced around 1.2mb/d of high-quality light sweet crude oil (see Exhibit 9). With the exports gone, the expected global oversupply in 1H2020 almost entirely vanished and 2H2020 now looked quite bullish. At the time, it was quite unclear how long the exports would remain shut-in.
Historically, exports resumed when demands from local groups that blocked exports were met. But this time, the situation is much more complex than just meeting financial demands of a few local interest groups. General Haftar seems to be using the exports as a bargaining chip in the ongoing international peace negotiations. He also seems to have the backing of local tribe leaders (who blocked the ports), which have been complaining about the unfair – or lack of – distribution of the oil revenues for years. Thus, the likelihood for a quick resumption of exports looked low in January (This view has since turned out to be correct. Six weeks into the disruption and a peaceful and quick resolution of the conflict seem very unlikely).
As oil exports could potentially remain offline for months, the Libyan situation turned an oversupply to a shortage overnight. Consequentially, oil prices rallied on these news and time-spreads became more steeply backwardated.
The Coronavirus outbreak starts impacting demand
This bullishness didn’t last long. Since oil prices peaked on the back of the Libyan news six weeks ago, oil prices sold off more than $20/bbl. Moreover, the Brent forward curve went from steep backwardation to contango. This sell-off is entirely driven by the outbreak of the Coronavirus in China. While there is a significant immediate impact on oil demand from the draconian measures taken by the Chinese government to contain the virus, we think the market is now pricing in wider demand destruction on the back of a global economic slowdown or possibly a global recession.
How much is oil demand affected in China? Chinese petroleum demand is roughly 13 mb/d, making it the second largest consumer in the world after the United States (see Exhibit 10). The below table show the breakdown of consumption by product:

We don’t have a lot of information out of China that would allow to directly calculate by how much oil demand is affected. The information we have suggests that air and rail travel and even car travel has decreased sharply, with some cities showing hardly any congestion in the streets. Thus, the hit from the transportation demand alone is most likely 2mb/d or even more as many international flights to and from China are suspended.
On top of that, manufacturing has come to an almost standstill in about 70% of the country. Over the past week, we saw some companies resuming operation, but only at a minority of plants in some regions. A lot of workers who came home from Lunar New Year are still required to stay at home. We estimate the total demand impact currently to be around 3mb/d. While this seems a lot, in our view, this alone cannot explain the dramatic move from backwardation to contango and the $20/bbl price decline in less than 4 weeks. We think the oil market is pricing in a sustained hit to global economic growth, to the point where it’s pricing in a significant probability of a global recession.
How big does the loss in oil demand have to be to warrant such a shift in the curve?
Our inventory-to-time-spread model allows us to back out how much the market is pricing in in terms of inventory builds. Prior to the outbreak of the Coronavirus, prompt prices traded 20% above longer-dated prices (5-year forward). Currently, prompt prices are trading 7% below the forward. In our time-spread to inventory model, such a move is equivalent to a 280-million-barrel build in global inventories. With 3mb/d of demand shut in, it would still take >3 full months of total Chinese lockdown in order to get to such a number, and that requires assuming that once the virus is contained, Chinese companies are not making up any of the lost production (and in turn oil demand). Hence, in our view, the shift in the Brent term structure is not simply reflecting lost Chinese demand, it is reflecting a sharp deterioration in global economic growth[1].
Assuming that lost Chinese demand is closer to 100 million barrels, 160 million barrels of inventory build (450kb/d) would have to come from lower economic growth outside of China. Our global demand model shows that a 1% change in global GDP accounts for 1 million b/d of oil demand. Thus, the market is now pricing in a 0.5% slowdown in global GDP on top of the slowdown in China. In other words, the oil market is pricing in global economic growth well under 3%. According to the IMF, the last time this has happened was during the finical crisis in 2009. Before that, one has to go back to the bursting of the dot.com bubble in 2002 to get to similar numbers.

Interestingly, commodity markets – oil and copper but also LNG and freight – are the only markets that seem to reflect this worldview. Equity markets on the other hand were making new highs even as the viral outbreak unfolded in China. While equities corrected sharply last week, equity markets have declined a lot less than commodities.
We may have already been in a recession before the Coronavirus outbreak
It may come as a surprise, but nobody really has a good handle on global oil demand. One would think that - given the importance of oil for the global economy - there would real-time in-depth data for oil demand across the globe. In reality, all demand data is of very poor quality, reported with a 2-3-month lag and very limited in scope (We only have data for OECD countries, which account for less than half of global demand). Furthermore, the data reported does not actually reflect what real demand is, it’s so called implied demand.
Meaning, the OECD member countries are obliged to report production of oil and petroleum products, changes in stocks as well as imports and exports. From those data points, implied demand is calculated. How much is actually consumed by cars, trucks, jets and heating boilers is unknown. In fact, for most regions, we don’t even know how much gasoline is sold at petrol stations. While some OECD countries report weekly implied demand data, it often comes with heavy revisions a few months later, to the extent that the weekly demand data reports are ignored by the oil market (the market focuses almost entirely on the inventory reports, as those are believed to be the least distorted). Hence, the best estimate we have for OECD demand is typically a few months old, and even that data often tends to be revised years later.
For non-OECD countries, demand data is even harder to obtain. Most non-OECD countries don’t report any data at all. Some do report some data, like China, but part of the data infers such strange results, that calculating implied demand becomes futile. Hence, non-OECD demand is typically just estimated based on economic growth projections. Hence, the global oil demand data that is typically reported and cited is simply a medley of notoriously bad OECD implied demand data and even less reliable estimates based on GDP predictions.
In addition, oil agencies such as the IEA typically publish balances that don’t balance. Meaning, supply minus demand does not equal changes in inventories on a global level. In other words, The IEA does calculate demand as implied demand bottom up for each country but applying the same data for a top down implied demand calculation for the world, leaves a huge error term. The reason typically provided for this error term, is that changes in non-OECD inventories are not part of the balance. However, we do have some inventory data from larger non-OECD economies, and taking those into account does not typically improve those balances, it often makes them worse.
Thus, when trying to get a glimpse of the state of global demand, we calculate top-down implied demand. Meaning, we aggregate changes in global inventories, including oil at sea and add supply, which should add up to global demand. Importantly, our implied demand number for 2019 shows very weak demand of just 0.7mb/d year-over-year. This is below of what most forecast agencies show. Moreover, while implied demand was still healthy in 1H2019, it slowed down dramatically in 2H2019.

The latest numbers suggest that global demand growth in 2H19 was barely positive year-over-year. This would be consistent with global GDP growth at just 2%. While data for the most recent month will likely see some revisions, the latest revision have shown larger inventory builds than previously reported. We see indications for economic weakness in other corners of the petroleum markets as well. Demand from the chemical sector, for example, often an early warning sign for economic slowdown, was very weak in recent months.
Is the oil market bearish enough?
The oil market is one of the few markets that predicts a larger global economic impact from the virus outbreak. However, in our view, what is priced into the current forward curve is still too optimistic. The current 0.5% impact is the bare minimum we expect as a potential fallout on the global economy. This would require:
- the draconian measured in China to be lifted over the coming weeks and business going back to normal (with heavy fiscal stimulus in 2H20),
- Other governments abstaining from any comparable measures (no wide spread travel bans and lock-downs)
- Companies outside China abstaining to close plants and offices and manage to remain productive
- The general population largely accepting that they may get the virus eventually and going their business as usual
This scenario seems increasingly unlikely. France reported last week that tourism activity was down 30-40%. By the time this number was reported, the country had only 12 reported cases, so France can’t have been particularly affected by travel cancellations. We can, thus, assume that traveling activity across the world is now heavily impacted. Italy has over 2000 cases now as the virus is spreading in the northern part of the country. South Korea is closing plants and Japan has announced to close all schools until spring break. Global supply chains will no longer be impacted just because Chinese companies can’t deliver, but increasingly because manufacturers from other nations are affected as well. While supply is affected first, we expect demand to suffer going forward. Layoffs mean people will have less disposable income. The hospitality sector will be hit hard, retail as well. Car sales in China have collapsed and there are early indicators that car sales are already slowing down in Europe. We believe that – despite the sell-off - barely any of this to be currently priced into oil markets, still less in other assets such as equities.
Conclusion
Markets became really excited about some better PMI data prior to the Coronavirus outbreak. The IMF predicted a reacceleration in growth from 3% in 2019 to 3.4%. In all likelihood, the impact of the Coronavirus will bring 2020 growth well below 3% even in the “contained” scenario with minimal knock-on effects on other economies, either through supply chain effects or reduced demand for goods (commodities) from China.
However, if economic activity was in fact already much weaker in 2H19 than what is generally assumed, the Coronavirus may be just what it takes to finally push the global economy into a deeper recession.
In such a scenario, we would expect equities to adjust to reality over the coming weeks.
At the same time, this should be very positive for gold. Despite the near-term deflationary effects from lower commodity prices, we expect central banks to quickly return to the financial crisis playbook by slashing rates and deploying some form of Quantitative Easing (QE) or more direct form of stimulation (helicopter money). This would propel gold prices sharply higher over the medium term.
[1] A three-month shutdown of the Chinese economy would also push the global economy into a recession
The views and opinions expressed in this article are those of the author(s) and do not reflect those of Goldmoney, unless expressly stated. The article is for general information purposes only and does not constitute either Goldmoney or the author(s) providing you with legal, financial, tax, investment, or accounting advice. You should not act or rely on any information contained in the article without first seeking independent professional advice. Care has been taken to ensure that the information in the article is reliable; however, Goldmoney does not represent that it is accurate, complete, up-to-date and/or to be taken as an indication of future results and it should not be relied upon as such. Goldmoney will not be held responsible for any claim, loss, damage, or inconvenience caused as a result of any information or opinion contained in this article and any action taken as a result of the opinions and information contained in this article is at your own risk.