Market positions for gold and silver
Jun 9, 2014·Alasdair MacleodThe purpose of this note is to draw attention to the extreme technical positions in the market for gold and silver. The information is derived from the weekly Commitment of Traders reports, and the monthly Bank Participation reports. It should be noted that while these are the most complete sets of market reports available they are essentially of hedging and speculative activity, which is not the same as physical demand. Nor do they cover other paper markets, some of which are growing in importance, such the Shanghai Gold Futures Exchange.
The background to these markets has been one of a shortage of physical stock, certainly from the beginning of 2013, if not before, due to escalating Asian demand. The end of the bull markets for precious metals occurred in late 2011 but there was no material liquidation of physical gold in the west until the concerted bear raid in April 2013. Since then ETF physical liquidation has been insufficient to meet growing Asian demand for physical gold, which has been met by central bank sales. The position in silver is more complex given the industrial demand component, but demand patterns for silver investment appear to have broadly coincided with gold.
There have been three bear raids on Comex since April 2013 which have occurred at six-monthly intervals, the first being a year ago today, followed by December, and the third is in progress. The bears appear to be timing their raids to coincide with end-quarter accounting periods, suggesting coordinated manipulation. The question arises as to whether or not the current raid will succeed.
Gold
The most important chart is of short positions in the Managed Money category. These are large speculative traders who are mostly hedge funds, high frequency traders and funds driven by algorithms. In essence they are trend-chasers which look to buy into rising markets and sell into falling markets.
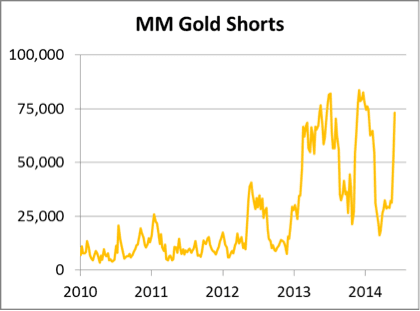
Note how volatile this measure has become since the hedge funds became convinced gold was in a bear market. In early 2013 insiders became aware a major bear raid was being planned and shorts went over 50,000 contracts for the first time. The first major peak over 75,000 contracts occurred in June 2013, when gold bottomed below $1200. The bears were subsequently squeezed before mounting another attack in early December, again driving gold below $1200. This time gold has held above $1240 and the conditions are in place for a third bear squeeze with shorts approaching the 75,000 contract level.
This chart is telling us is that the Managed Money category is building short positions into the end of the second quarter, expecting another end-quarter price drop, and for the price to move to new lows below $1200.
The other side of this speculative activity is taken by the banks and commercial hedging. The next chart is of US and foreign bank net positions.

For the last three and a half years non-US banks have maintained an even net short position of 40,000 contracts. This one would expect, because market makers, which is effectively the role bullion banks take, normally run a short book. Before the market peak in September 2011 US banks (usually three or four in number) were badly squeezed by the bullish trend, reflected in the rapid expansion in demand for synthetic gold ETFs, until the price trend turned negative in 2012.
The price smash in April 2013 allowed US banks to actually go long futures, and they remain net long to this day (just). This indicates that the US banks are relatively neutral about market outcomes, while non-US banks are jobbing normally on the bear tack and short 32,818 contracts, the equivalent of about 100 tonnes of gold.
The next chart is of non-bank commercials. These are mines and scrap merchants hedging production and refiners and other commercial buyers hedging their estimated future demand.
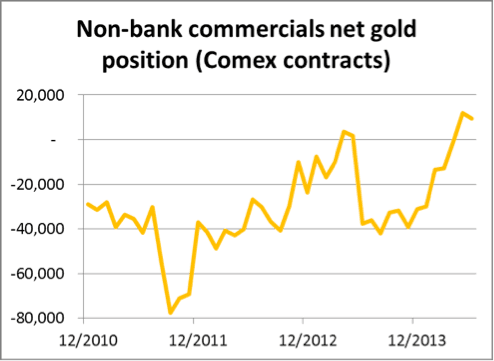
The deeply short position in the run-up to late 2011 reflected hedging activity by the mines. Predictably they used improving margins over mining costs to lock in profits. Mines came under pressure from shareholders to reduce hedging, which they did until April 2013 when this chart went briefly positive. The price smash that month changed investor sentiment in western capital markets and mines began to hedge again and processers delayed purchases. However, as prices moved closer to cost-of-production, commercial hedging lessened to the point where non-bank commercials are now net long about 30 tonnes.
This is an unusual position in the futures market. It tells us there is no net primary supply at these prices, justifying the US banks maintaining a level-to-positive book. Non-US banks can see free-world mine supply of about 8 tonnes as a daily average, so their shorts are the equivalent of about two or three weeks of this supply.
Conclusion
We are heading for another bear squeeze which is potentially more violent than the previous two, because of the lack of counterbalancing liquidity from commercial hedges. It all depends on the US banks and whether they wish to go short again at these levels. They are not ignorant of the escalation in Asian demand and are unlikely to increase their shorts significantly. And with the London market coming under intense regulatory scrutiny and with the future of the daily fix in doubt, bullion banks are likely to be more cautious over taking aggressive positions.
Silver
Now let us look at silver, using the same market data. The shock comes with our first chart, which is of Managed Money short positions.

These trend-chasers have got themselves into a potential trap, with short positions totalling 214,020,000 ounces, equivalent to 25% of annual global mine output. Whether or not they can extricate themselves from this position will depend on the banks and commercial hedgers providing the liquidity for them to do so.
To some extent this extreme bear position has been balanced by an increase in Managed Money longs. These include synthetic ETFs so the net position is nearly always long: that is until the current bear raid which has turned this investor category net short 7,638 contracts. The impending run-off of the July contract will have an important effect in the next two weeks, with some 97,000 contracts to be closed or rolled.
Next we look at the net position of the banks taken from the Bank Participation Report.
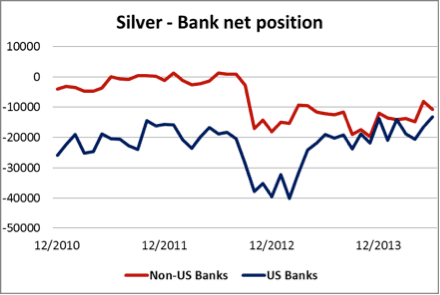
The interesting feature in this chart is that the two or three US banks in this market have reduced their net short position to the lowest level of the last four years. Furthermore, non-US banks have reduced their net shorts to about 10,000 contracts. This suggests that as a group banks take the view silver is unlikely to go much lower in the medium term.
The next chart is of non-bank commercials.

With the banks stripped out, miners, refiners and industrial users have maintained a net long position since October 2012, when according to the CTFC, a commercial dealer with a large short position was reclassified as a bank. After taking account of this adjustment non-bank commercials have tended to run a balanced position, with industrial users currently buying forwards to a greater extent than mines hedging directly into the market.
Conclusion
The managed money silver shorts are far too large relative to offsetting liquidity from the banks and commercial users of the market. By definition they are more speculative than managed money longs, which have increased to a lesser degree. If we make the reasonable assumption that banks will take the opportunity to squeeze the managed money speculators, silver has the potential to move sharply higher very quickly. In which case, a bear squeeze in this relatively illiquid market could accelerate a corresponding bear squeeze in gold. However, the expiry of the July contract could make the precise timing unpredictable.
The first week in July, if not sooner, should see a significant recovery in gold and silver prices, based on the technical market position on Comex, and may well mark the point from which prices go considerably higher, given the extremes of negative sentiment in the managed money categories.