Gold Price Framework – The next cycle unfolds
Jun 20, 2019·Goldmoney InsightsBased on the findings of our gold price framework, we have long argued that we have entered a new gold cycle. However, until now, there was always the risk that strong economic growth could allow the Fed to raise rates above what the FOMC members themselves expected was possible. As markets and the Fed itself rapidly adjust to the new reality of a slowdown in economic growth, those risks have subsided, bolstering our conviction that the next gold cycle is about to unfold.
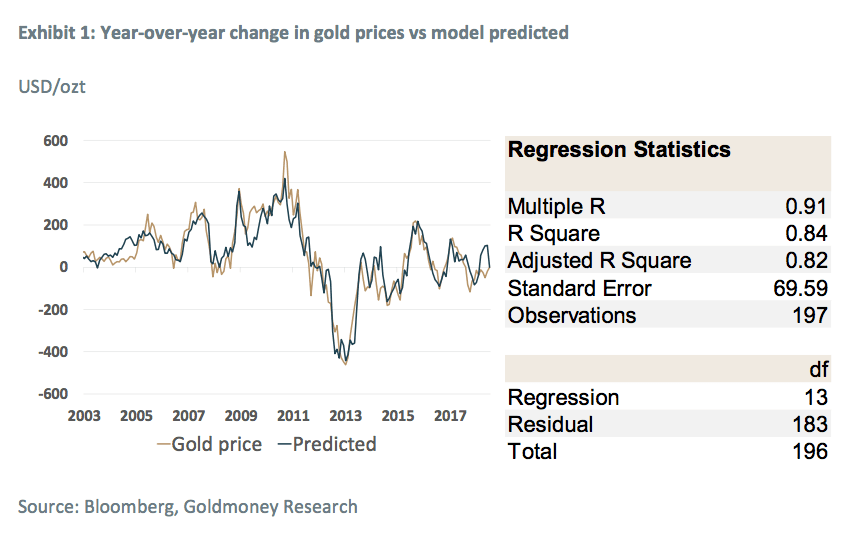
In 2018 we published a 3-part series “Gold Price Framework Vol. 2: The Energy Side of the Equation” in which we presented our revised gold price model (part 1), took a deeper dive into the link between longer-dated energy prices and gold by doing an in-depth analysis of the energy exposure of gold mining companies (part 2), and gave an outlook for gold prices (part 3).For those unfamiliar with our model, we recommend reading at least part 1 to get a better understanding of our findings in this report. In a nutshell, we found that the majority of changes in gold prices can be explained by just three drivers: Central bank policy (more specifically real-interest rate expectations and QE), changes in longer-dated energy prices, and central bank net gold purchases (the least important driver). These three drivers can explain over 80% of the year-over-year changes in the gold price (see Exhibit 1).
Based on the outlook for the main drivers of the gold prices, we reiterate our view that the risk to gold prices is clearly skewed to the upside, a position we are holding since early 2016. While our bullish view on gold remains unchanged, there is a clear change in our conviction level. For the past three years we have held the view that we are in a new up-cycle but we always maintained a somewhat cautious stance as we could see a near-term scenario where the Fed was able to continue to raise rates on the back of an acceleration in economic growth. We now think that this risk has all but vanished, with global economic growth pointing down, the FOMC members themselves cutting their future rate expectations and the market beginning to price in rate cuts rather than further rate hikes. In other words, the next cycle is about to unfold.
current gold price cycle started at the end of 2015…
Since we have presented our gold price framework the first time in late 2015, we have argued that we have entered a new cycle in the gold market. At the time we believed that longer-dated oil prices (5-year forward Brent) had likely set a bottom in late 2015 (at US$47/bbl, now US$60/bbl) and that real-interest rate expectations (10-year TIPS yields) were close to their cycle peak at 0.8% (now 0.3%) (see Exhibit 2). Our view was that – while there was some room to the downside – risk for gold prices were clearly skewed to the upside. While we weren’t extremely bullish near term for longer dated energy prices[1], the reason for our bullish view on gold was that we saw much more downside risk than upside risk for real-interest rate expectations.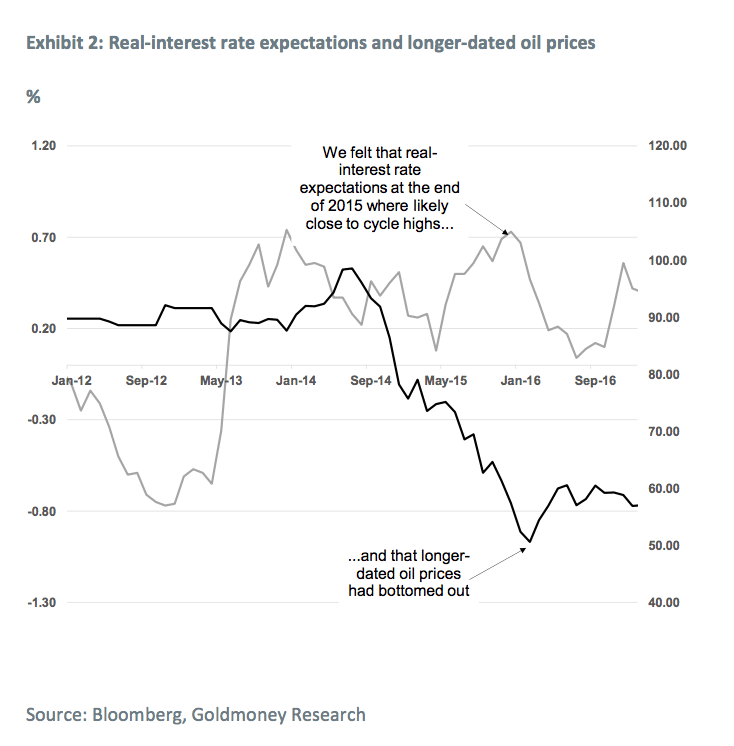
By the end of 2015, the FOMC members were predicting terminal Fed funds rates at 3.5% (see Exhibit 3). The Fed also has a PCE (Personal Consumption Expenditure) inflation target of 2%, which, in our view translates into CPI (Consumer Price Inflation) of around 2.5-3% that is embedded in TIPS yields. Thus, we expected TIPS yields not rise much above 1% even if the Fed was able to raise rates as many times as it signaled at the time. 
However, we also acknowledged that there was significant uncertainty about the path of real-interest rate expectations for the next few years. The Fed’s famous dot plot simply shows what the FOMC members expect for future nominal rates, not their stated target. A sharp pick-up in economic activity could allow the Fed to raise rates further. In our view, a “normal” 10-year treasury yield of 5-6% would have had quite a strong negative impact on gold prices. Assuming that the Fed would stick to its inflation target of 2%, real-interest expectations would most likely be around 2-2.5%[2]. All else equal, our model would predict gold prices to drop below US$1,000/ozt in such an environment.
In the aftermath of 2016 US presidential elections, that was exactly what the market started to price in. The market hoped that deregulation would unleash economic growth that would offset the negative impact of the Fed unwinding its balance sheet. And for a while, it looked like the economic environment in the U.S. did indeed gain steam and surprised both the market and the Fed. In turn, the FOMC members started to raise their expectations for terminal rates from just 2.75% back to 3%.
While this pushed 10-year inflation expectations from 1.2% in early 2016 to 2.2% in 2018, nominal rates rose even more quickly as the Fed was finally able to raise rates multiple times a year, pushing the 10-year Treasury yield to 3.2% in late 2018. The result was that real-interest rate expectations rebounded one more time to 1.2% (see Exhibit 4)

Gold has predictably struggled a little bit in this environment, but the dreaded gold bear market scenario never materialized. The price of gold was close to US$1,300/ozt before election day and it was down less than US$100/ozt by the time we saw peak rates late last year, despite also being in a bearish energy environment.
Part of the reason for this resilience is that, while the Fed tightened monetary conditions by raising rates and unwinding its balance sheets, central banks globally continued to ease, and total central bank assets are right now at an all-time high. This also explains why gold prices in some other currencies are also at all-time highs. On net, the up cycle that started in 2015 remains intact, and it just got confirmed by the Fed.
…and it just got confirmed by the chairman of the FED
The optimism about the pick-up in U.S. economic growth proved to be short lived, and over the past couple months, the FOMC members gradually lowered their expectations to 2.5% (see Exhibit 5) and, more importantly, slashed their expectations for the Fed funds rate by the end of 2019 to just 2.375%, implying zero hikes.

We argue however that, taking historical Fed policy into account, the market seems yet to be much too optimistic. As we have highlighted before, over the past 30 years, the Fed slashed rates by 5.5% on average when the US entered a recession. This would imply steeply negative 10-year treasury rates (see Exhibit 7).

And that doesn’t even take the high likelihood into account that the Fed will revert to what was once referred to as unconventional monetary policy: Quantitative Easing (QE). In our view, the most important development in regards to monetary policy was not the FOMC members’ change of heart in terms of forward outlook (the market anticipated that for some time now), but a remark by Fed chairman Powell during a conference on June 4, 2019. Powell sent a powerful message to the market by preparing it for what most people in the gold market have expected all along: that quantitative easing should no longer be considered unconventional but in the future should be a standard tool in the Fed’s arsenal. Powell said:
“There will be a next time,”...[Interest rates so close to zero] “has become the preeminent monetary policy challenge of our time. Perhaps it is time to retire the term ‘unconventional’ when referring to tools that were used in the crisis. We know that tools like these are likely to be needed in some form in the future.”
And not to be outdone by the Fed, ECB President Mario Draghi stunned markets two week later when speaking at the ECB Forum in Portugal by saying:
“In the absence of improvement, such that the sustained return of inflation to our aim is threatened, additional stimulus will be required”
Given that the ECBs target rate has remained at zero, this could only mean more quantitative easing, or a derivate thereof. In other words, when the next recession comes, expect a lot more QE, not just from the Fed, but from virtually every major central bank.
And it’s just the logical conclusion. If the Fed cannot raise rates over 2.5% before the next recession, slashing rates by 5.5% means the new target rate would have to be -3%. That is a level of NIRP no other central bank has come even close to. The Swiss national bank has been keeping its target rate at -0.75% for the past years, but it argues it is doing this to keep the Swiss Franc from appreciating too much as the surrounding economies of Europe struggle, rather than trying to stimulate the Swiss economy. Hence, it seems inevitable that QE will be redeployed when the next recession arrives, and rates will cut to at least zero.
While the timing of all this is unclear, the direction is not. Arguably the U.S. economy has so far shown remarkable resilience to rising interest rates, an inverted yield curve, higher energy prices (until very recently) and an escalating trade war between China and the U.S., and potentially other countries[3]. And should the U.S. and China resolve their trade dispute, we could expect a short term rebound in confidence and economic activity. But rates have reached a threshold where they start to have a meaningful, and in our view irreversible effect on the economy. Real estate markets in major cities, which for 10 years knew only one direction, have already started to struggle. Recent employment numbers have also been less than encouraging. And higher U.S. rates have taken a toll on the rest of the world as well. European PMI numbers, for example, have been weak for months. And China has its own issues, likely exacerbated by the ongoing trade war.

Hence in our view, it’s a question of when – rather than if – the U.S. enters the next recession. In a few weeks, this will become officially the longest period of economic expansion in U.S. history, exceeding the 120 straight months of economic expansion from 1991 until 2001. Given the strong headwinds for economic growth, we have little hope that this expansion has a lot more lifetime. And it seems that the Fed is now agreeing. While the Fed has left its target rate unchanged in the June meeting, both the language in the Feds’ statement as well as the rate expectations of the individual FOMC members has changed significantly. At their March meeting, the median expectation of the FOMC members for end of 2019 and end of 2020 rates was 2.375% and 2.625%. Three months later the end of 2020 expectations have dropped to just 2.125% and while the end of 2019 median expectations remained the same, 8 members now expect lower rates from previously none. The market is taking this as an indication that it is imminent that Fed will reverse course and start cutting rates.
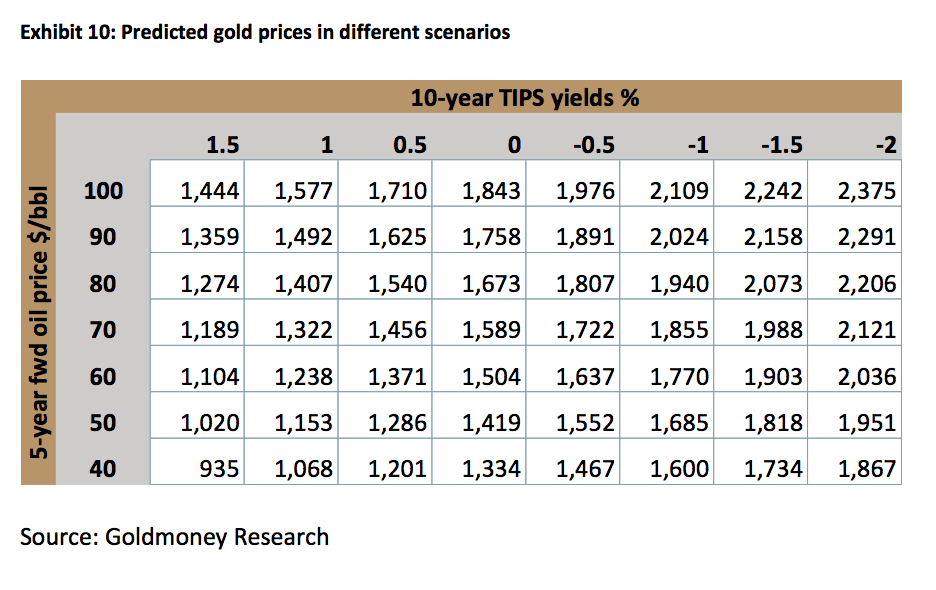
In our view this means that we are now solidly in the next cycle. The risk of sharply higher rates – meaning 5-6% - are firmly off the table. The next big move in real-interest rate expectations thus will be down. The table below shows the model output for different scenarios (see Exhibit 10). It is important to highlight that QE has a positive effect on gold that goes beyond QE’s impact on real-interest rate expectations. Hence more QE will not just push gold higher through lower real-interest rate expectations but is a positive driver on its own. QE’s impact on gold is much harder to estimate in a multiple regression analysis though. Every round of QE had a different impact, and so did the tapering and the subsequent unwind. Hence in the table we show where the model predicts gold prices to go under different scenarios of real-interest rate expectations and longer-dated energy prices. More QE implies that there is more upside to these targets.
[1] And still aren’t, we just don’t see much downside either. We do think there lot of upside medium to long term though, see “Crude Oil – The Next 5 Years, 14 May, 2018”
[2] There is an alternative scenario where nominal rates rapidly rise because inflation is rising above the target rate. In this scenario, real-interest rate expectations would most likely decline and become deeply negative.
[3] Potential tariffs for Mexican goods seem to be averted for now, but given how effective tariffs have been proven in this case could mean that the US administration will use this measure as leverage elsewhere.
The views and opinions expressed in this article are those of the author(s) and do not necessarily reflect those of Goldmoney, unless expressly stated. The article is for general information purposes only and does not constitute either Goldmoney or the author(s) providing you with legal, financial, tax, investment, or accounting advice. You should not act or rely on any information contained in the article without first seeking independent professional advice. Care has been taken to ensure that the information in the article is reliable; however, Goldmoney does not represent that it is accurate, complete, up-to-date and/or to be taken as an indication of future results and it should not be relied upon as such. Goldmoney will not be held responsible for any claim, loss, damage, or inconvenience caused as a result of any information or opinion contained in this article and any action taken as a result of the opinions and information contained in this article is at your own risk.