
For some time, the behaviour of gold and silver prices has diverged, with silver’s underperformance since 2 April now correcting. This report looks at silver’s price drivers.
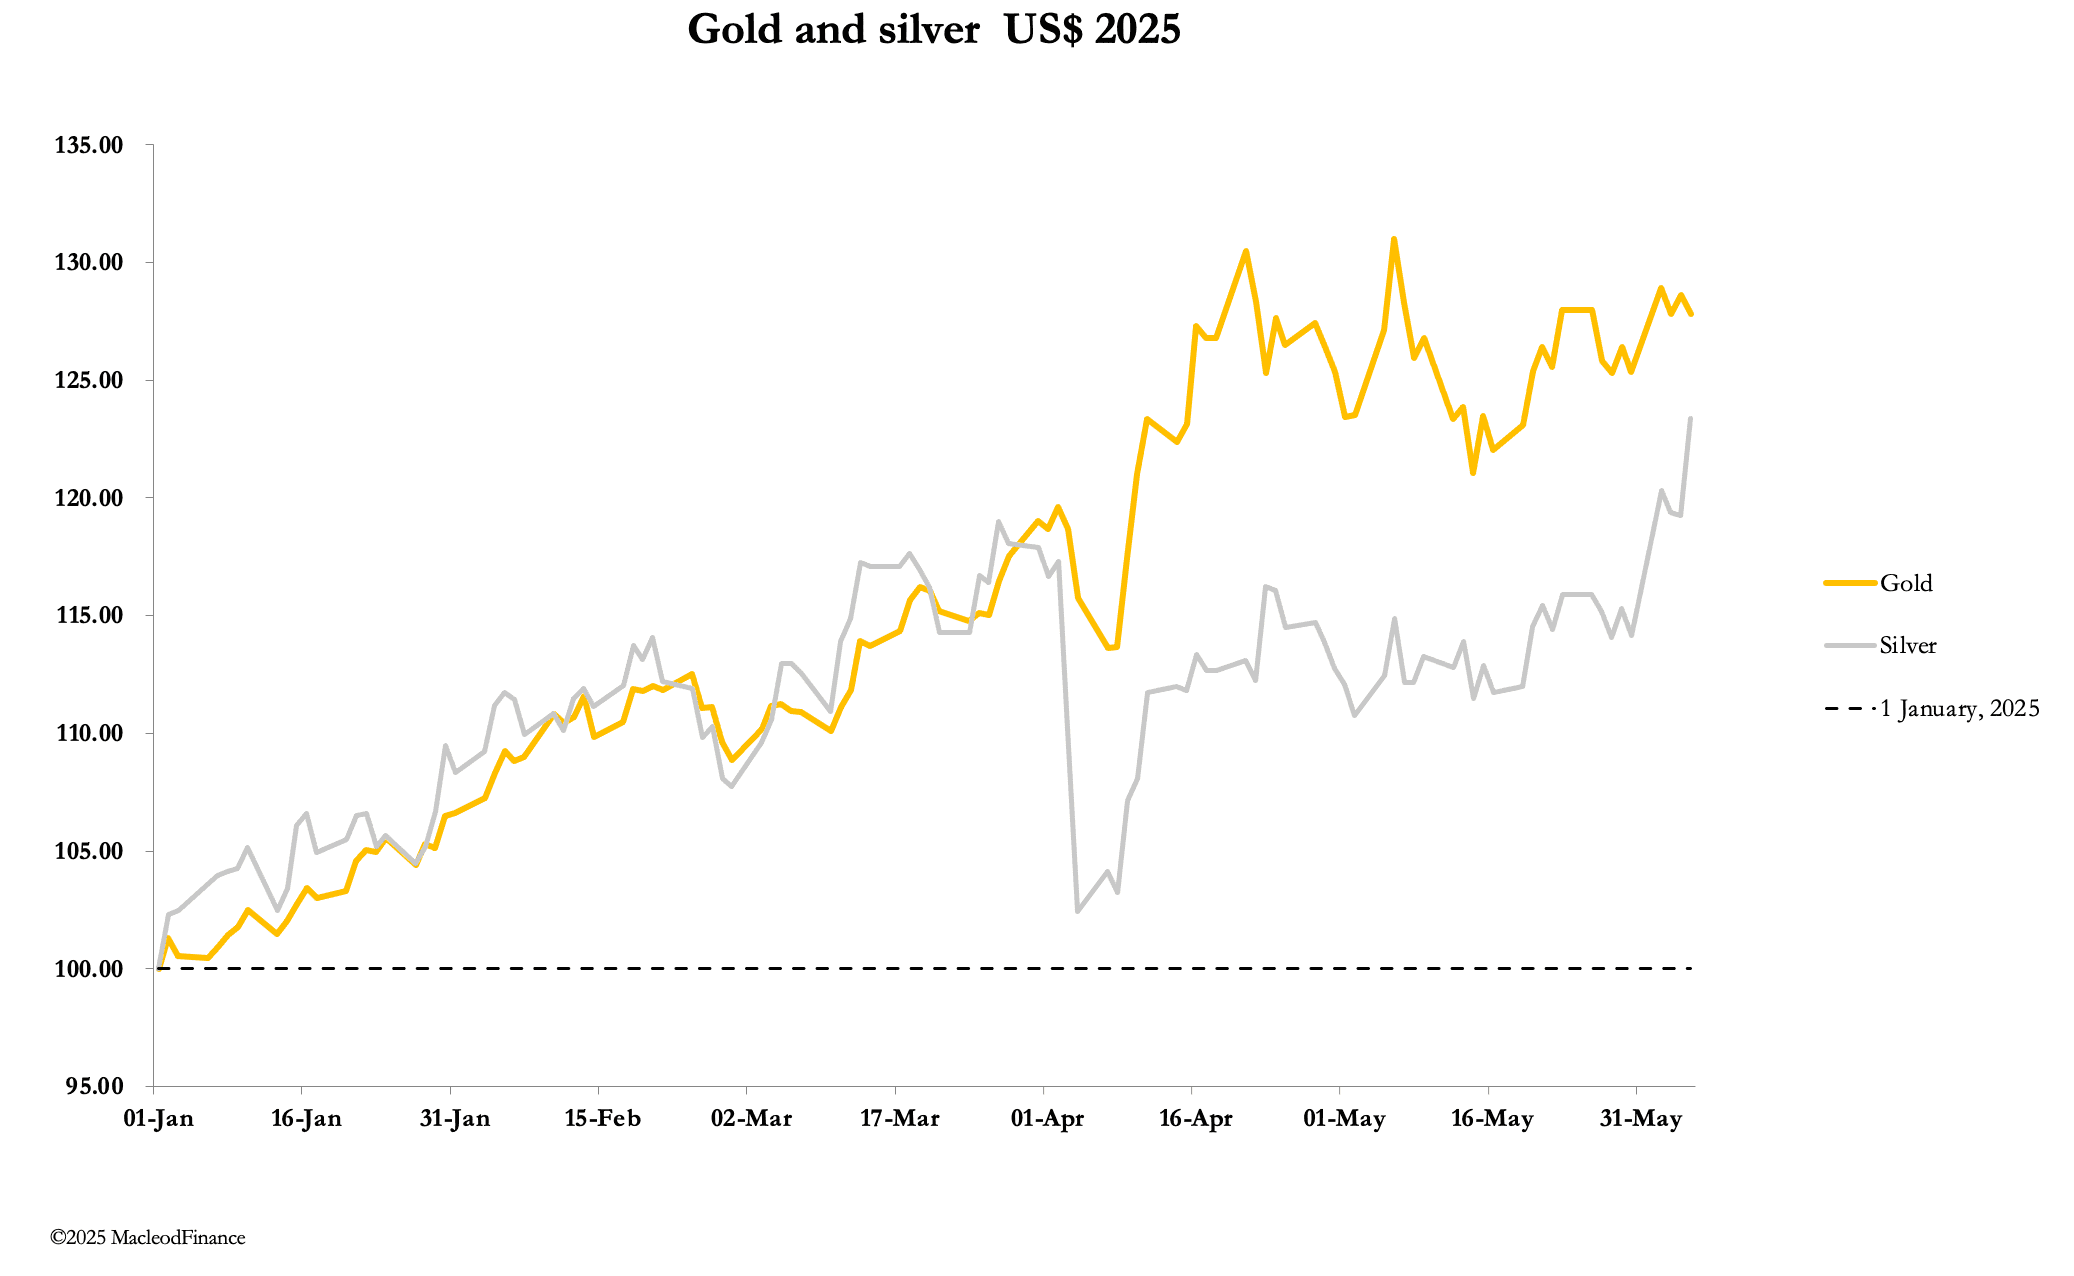
This week, silver broke out into 12-year high ground on huge Comex volume, while gold with a firm undertone continued its recent consolidation. In European morning trade, gold was $3360, up $70 from last Friday’s close. Silver was $36.10, up $3.15.
Gold and silver are behaving differently. Judging by Comex open interest, gold is oversold and silver overbought, shown in the charts below:
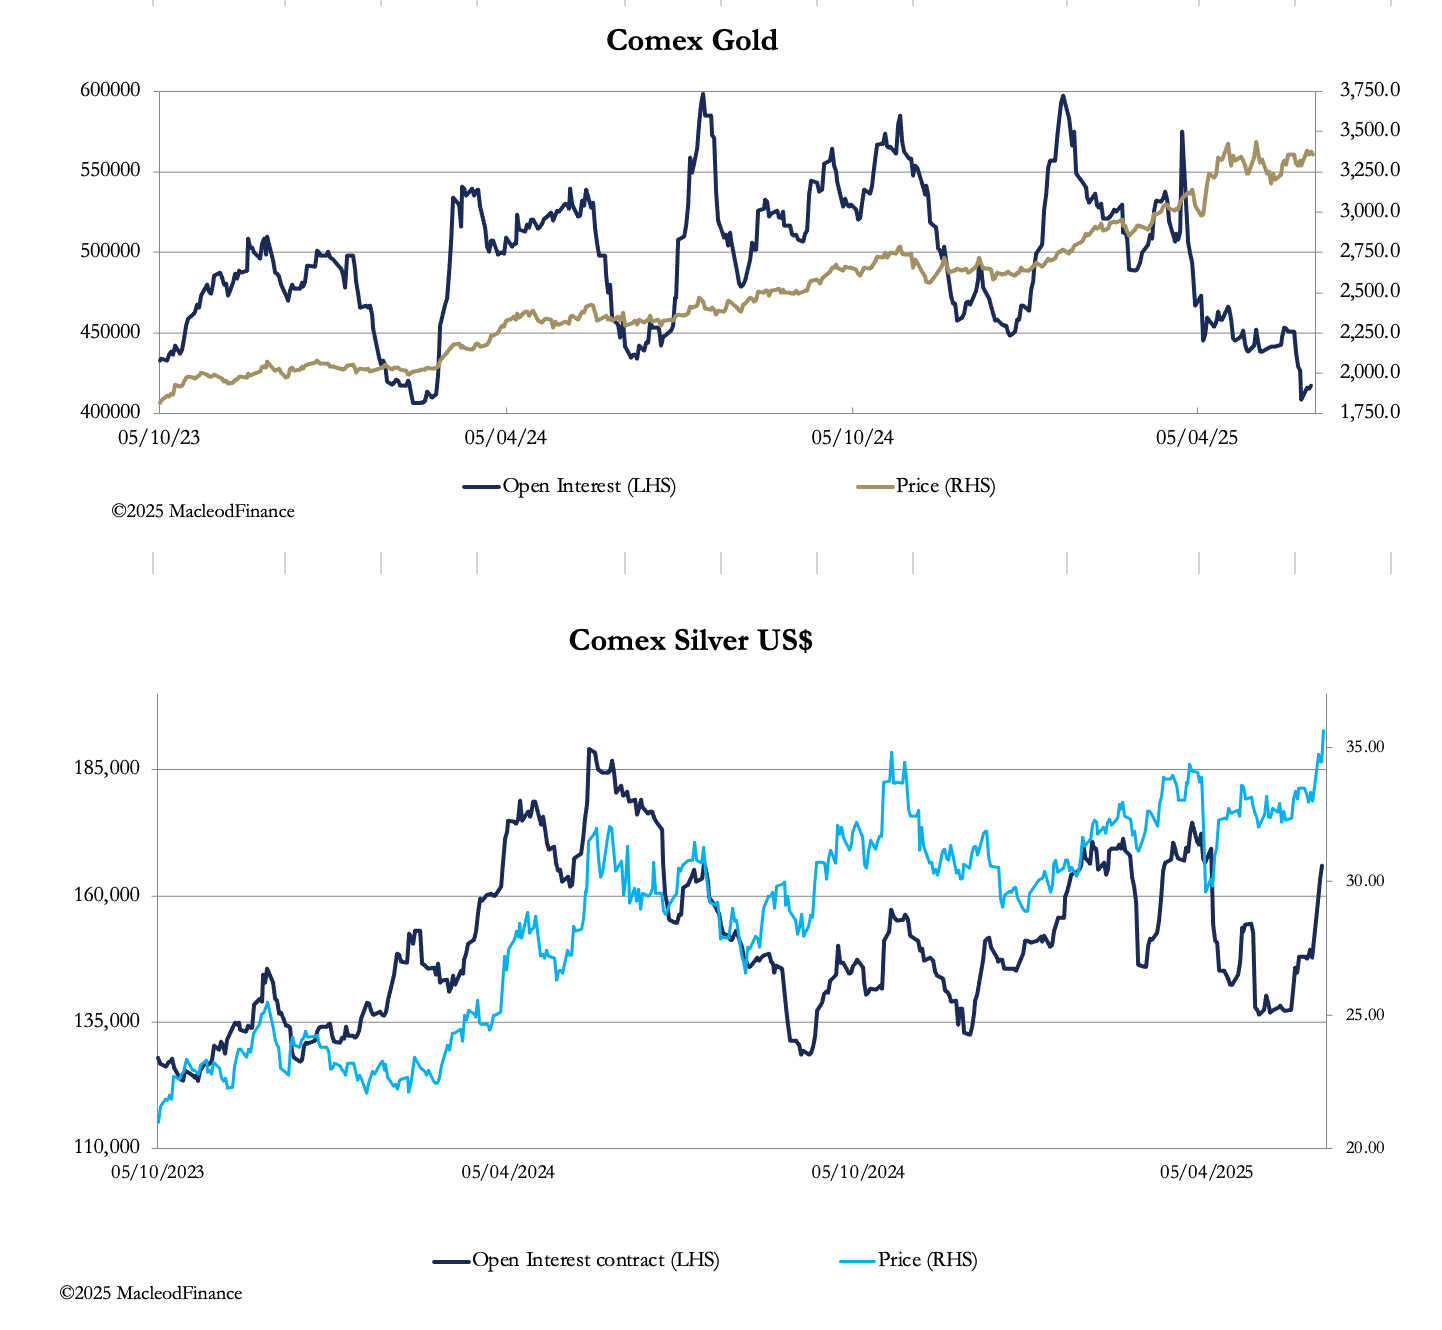
Note how gold is rising even as speculators have been selling. And it’s not just speculators: according to the World Gold Council, global gold ETF holdings declined by 19 tonnes in May, with only Europeans adding to their positions. North Americans and Asians were net sellers, presumably taking profits. Any technical analyst will tell you that this is a very bullish setup for gold, because the charts indicate that there are very few weak holders left.
Silver is different. Sharply rising Comex open interest tells us that silver has got quickly overbought and is due for a correction. A pullback to test the $34—$35 level seems reasonable; it is almost required to support further advances. However, the sheer strength in its advance is characteristic of a strong underlying bull market, pointing to higher levels. Illustrated next is silver’s technical chart:
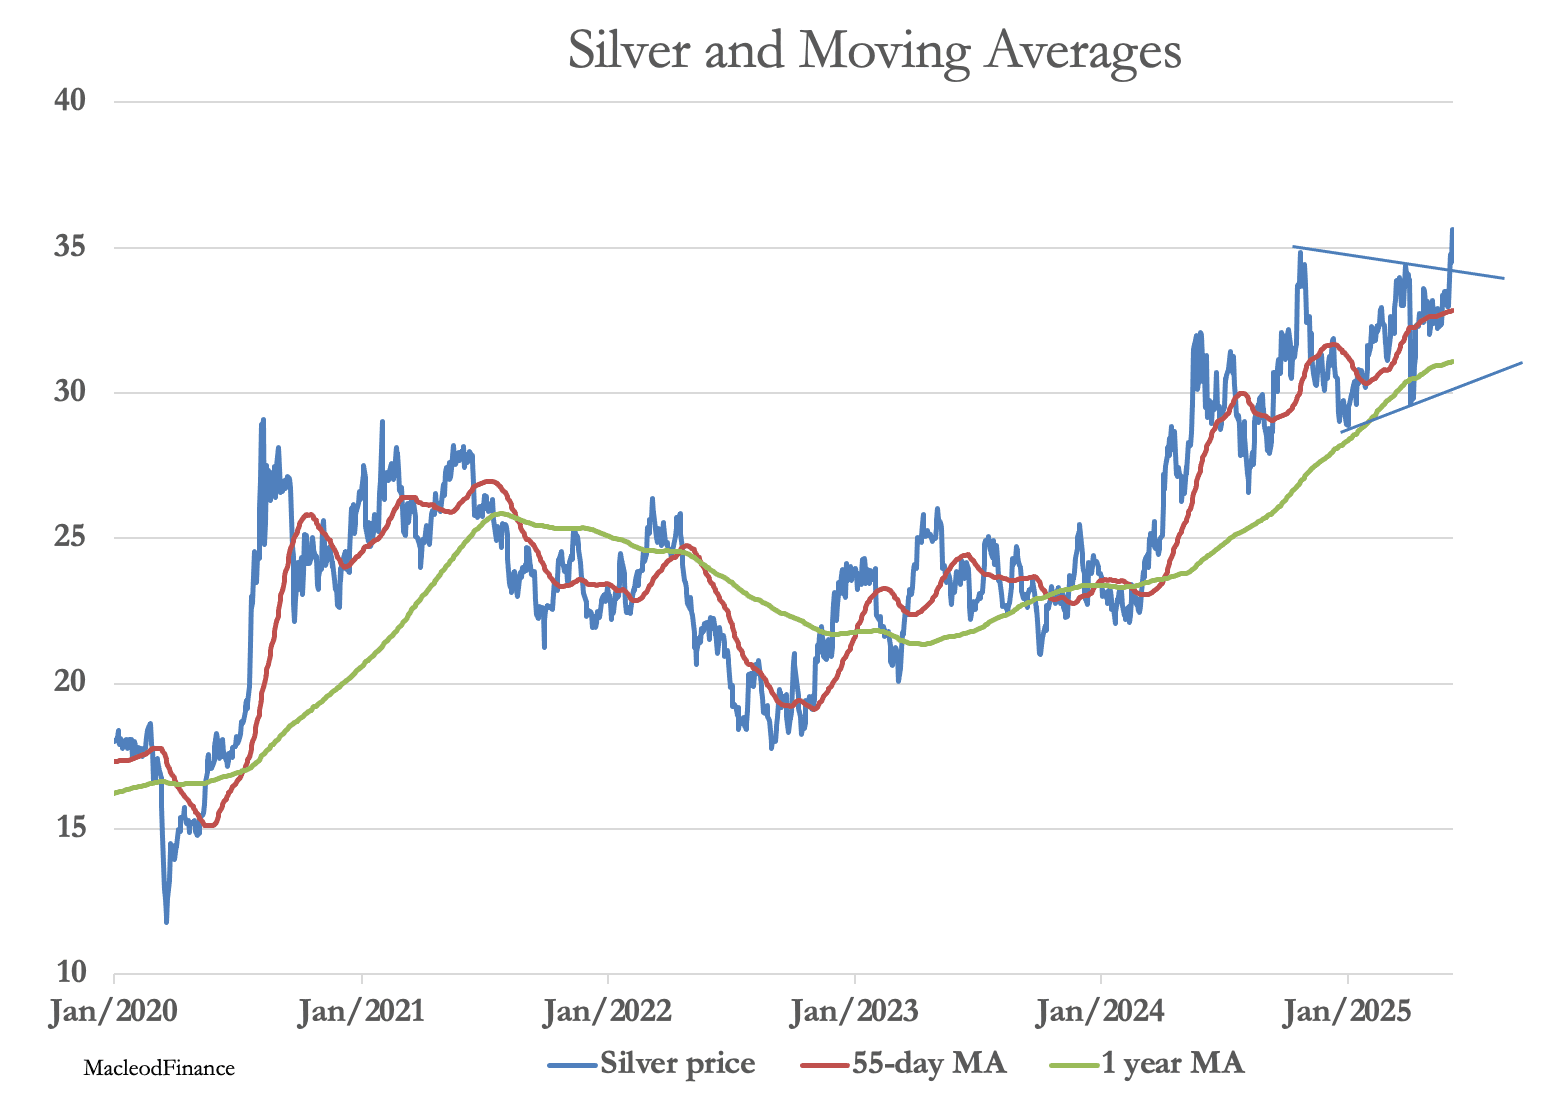
Silver has just cleared a pennant pattern, defined by the two trend lines, signalling a price target of $48. This is what Edwards & Magee (Technical analysis of Stock Trends — the technical analysts’ vade mecum) says about pennants:
“These pretty little patterns of consolidation are justly regarded as among the most dependable of chart formations, both as to directional and measuring indications. They do fail occasionally but almost never without giving warning before the pattern itself is completed.”
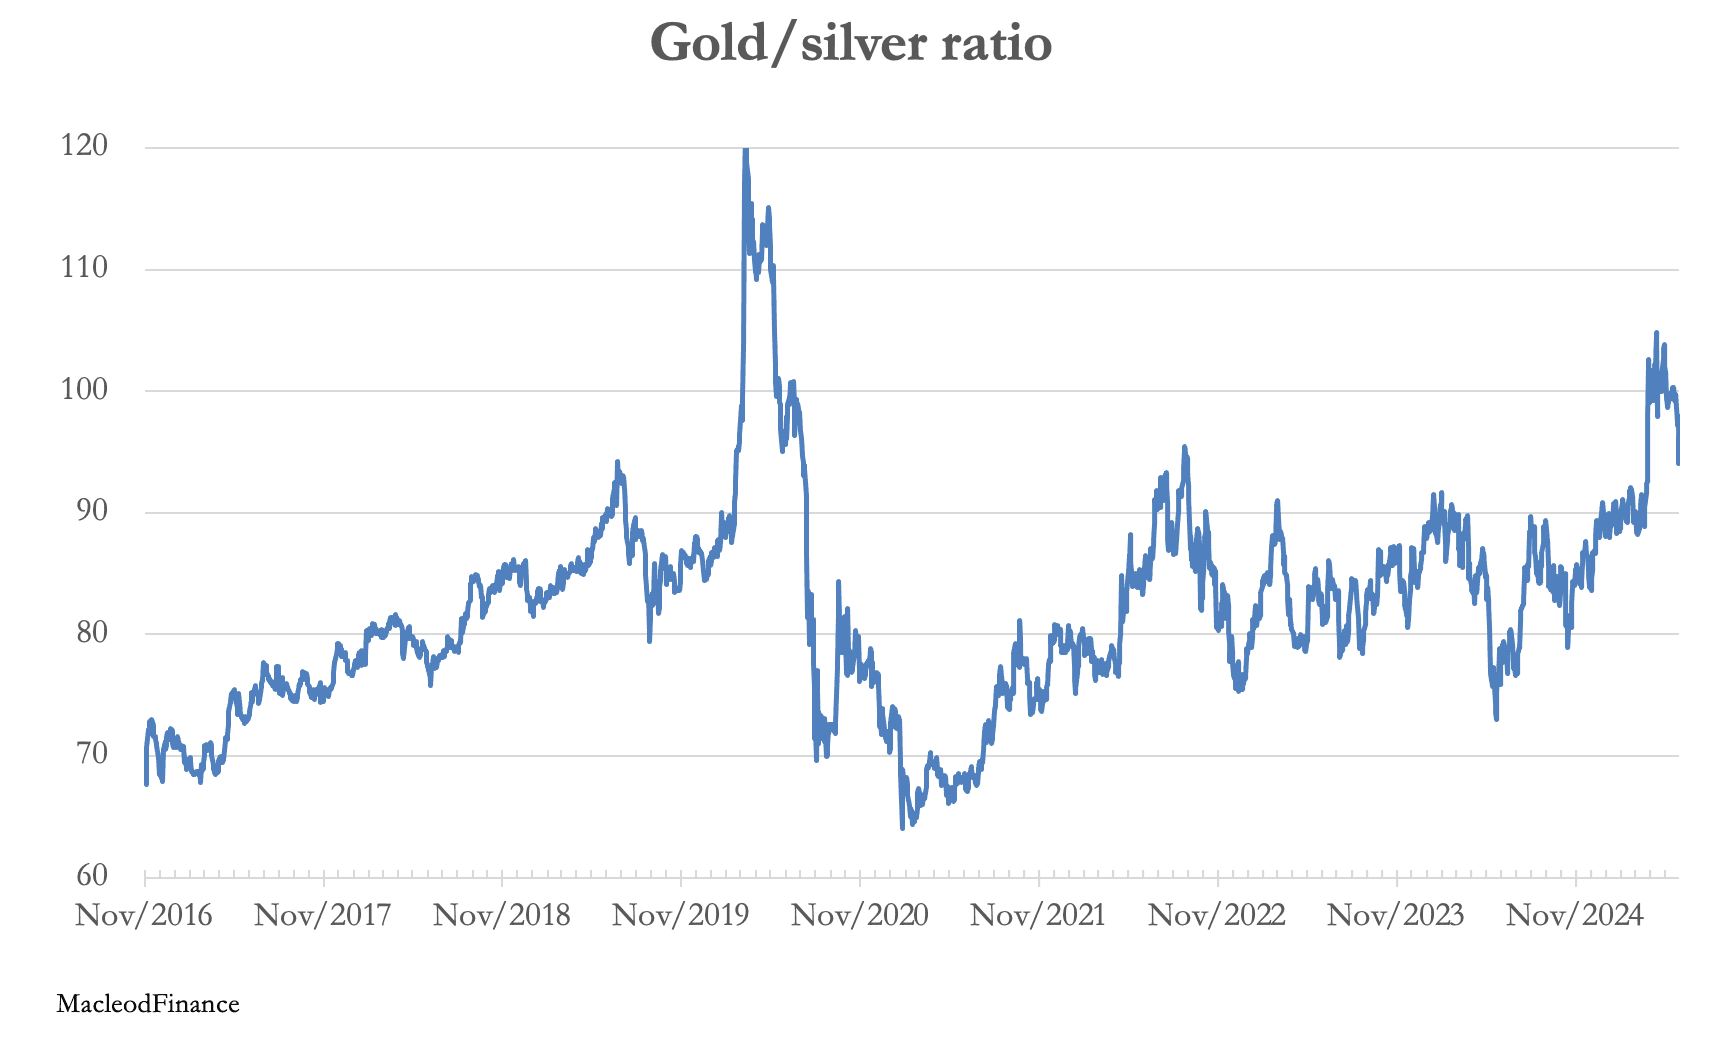
As an indication of silver’s cheapness relative to gold, the gold silver ratio has fallen significantly this week, and appears likely to decline into the 75—80 region should the trend continue:
We must not ignore the fundamentals likely to have driven silver’s sudden breakout. Other than silver being undervalued as a monetary metal, here are the likely factors:
- For the last five years, silver has been in supply deficit. The evidence suggests that for decades China has been suppressing the price in order to accumulate significant reserves cheaply, and that its suppression scheme is ending. In recent years, China has been forced to sell some of her silver to keep a lid on prices, a policy which is no longer tenable.
- The Peoples Bank of China is the only central bank tasked with managing national silver reserves. China has a more recent history of silver standards, only abandoning the last one in 1935, which probably explains why the CCP leadership regarded it as a monetary metal when it delegated this function to the PBOC in 1983. Therefore, recent developments undermining the US dollar’s credibility are likely to have stopped silver exports being authorised by the PBOC.
- Supplies to Comex warehouses have peaked, which combined with accelerating stands-for-delivery is squeezing the physical outlook. This year, stands-for-delivery total 218,400,000 ounces so far versus warehouse stocks of 495,544, 188 ounces —a cover ratio of 2.27. With China appearing to be withdrawing from being the marginal physical supplier, this must be a concern for the bullion banks.
- Moderate profit-taking in gold ETFs suggests that public demand for ETFs, bar, and coin is switching to silver. The behaviour of Asian investors is particularly interesting in this respect.
Meanwhile, in an interview with Adam Taggart of Thoughtful Money Substack, Joanne Hsu Director of Consumer Surveys at the University of Michigan reported that US consumer sentiment is eroding rapidly “across almost every dimension”. There’s little doubt that this loss of consumer confidence will be reflected in future economic statistics. If so, it will be bad for the Federal Government’s debt trap and therefore for the dollar, whose trade-weighted index appears to be heading lower:
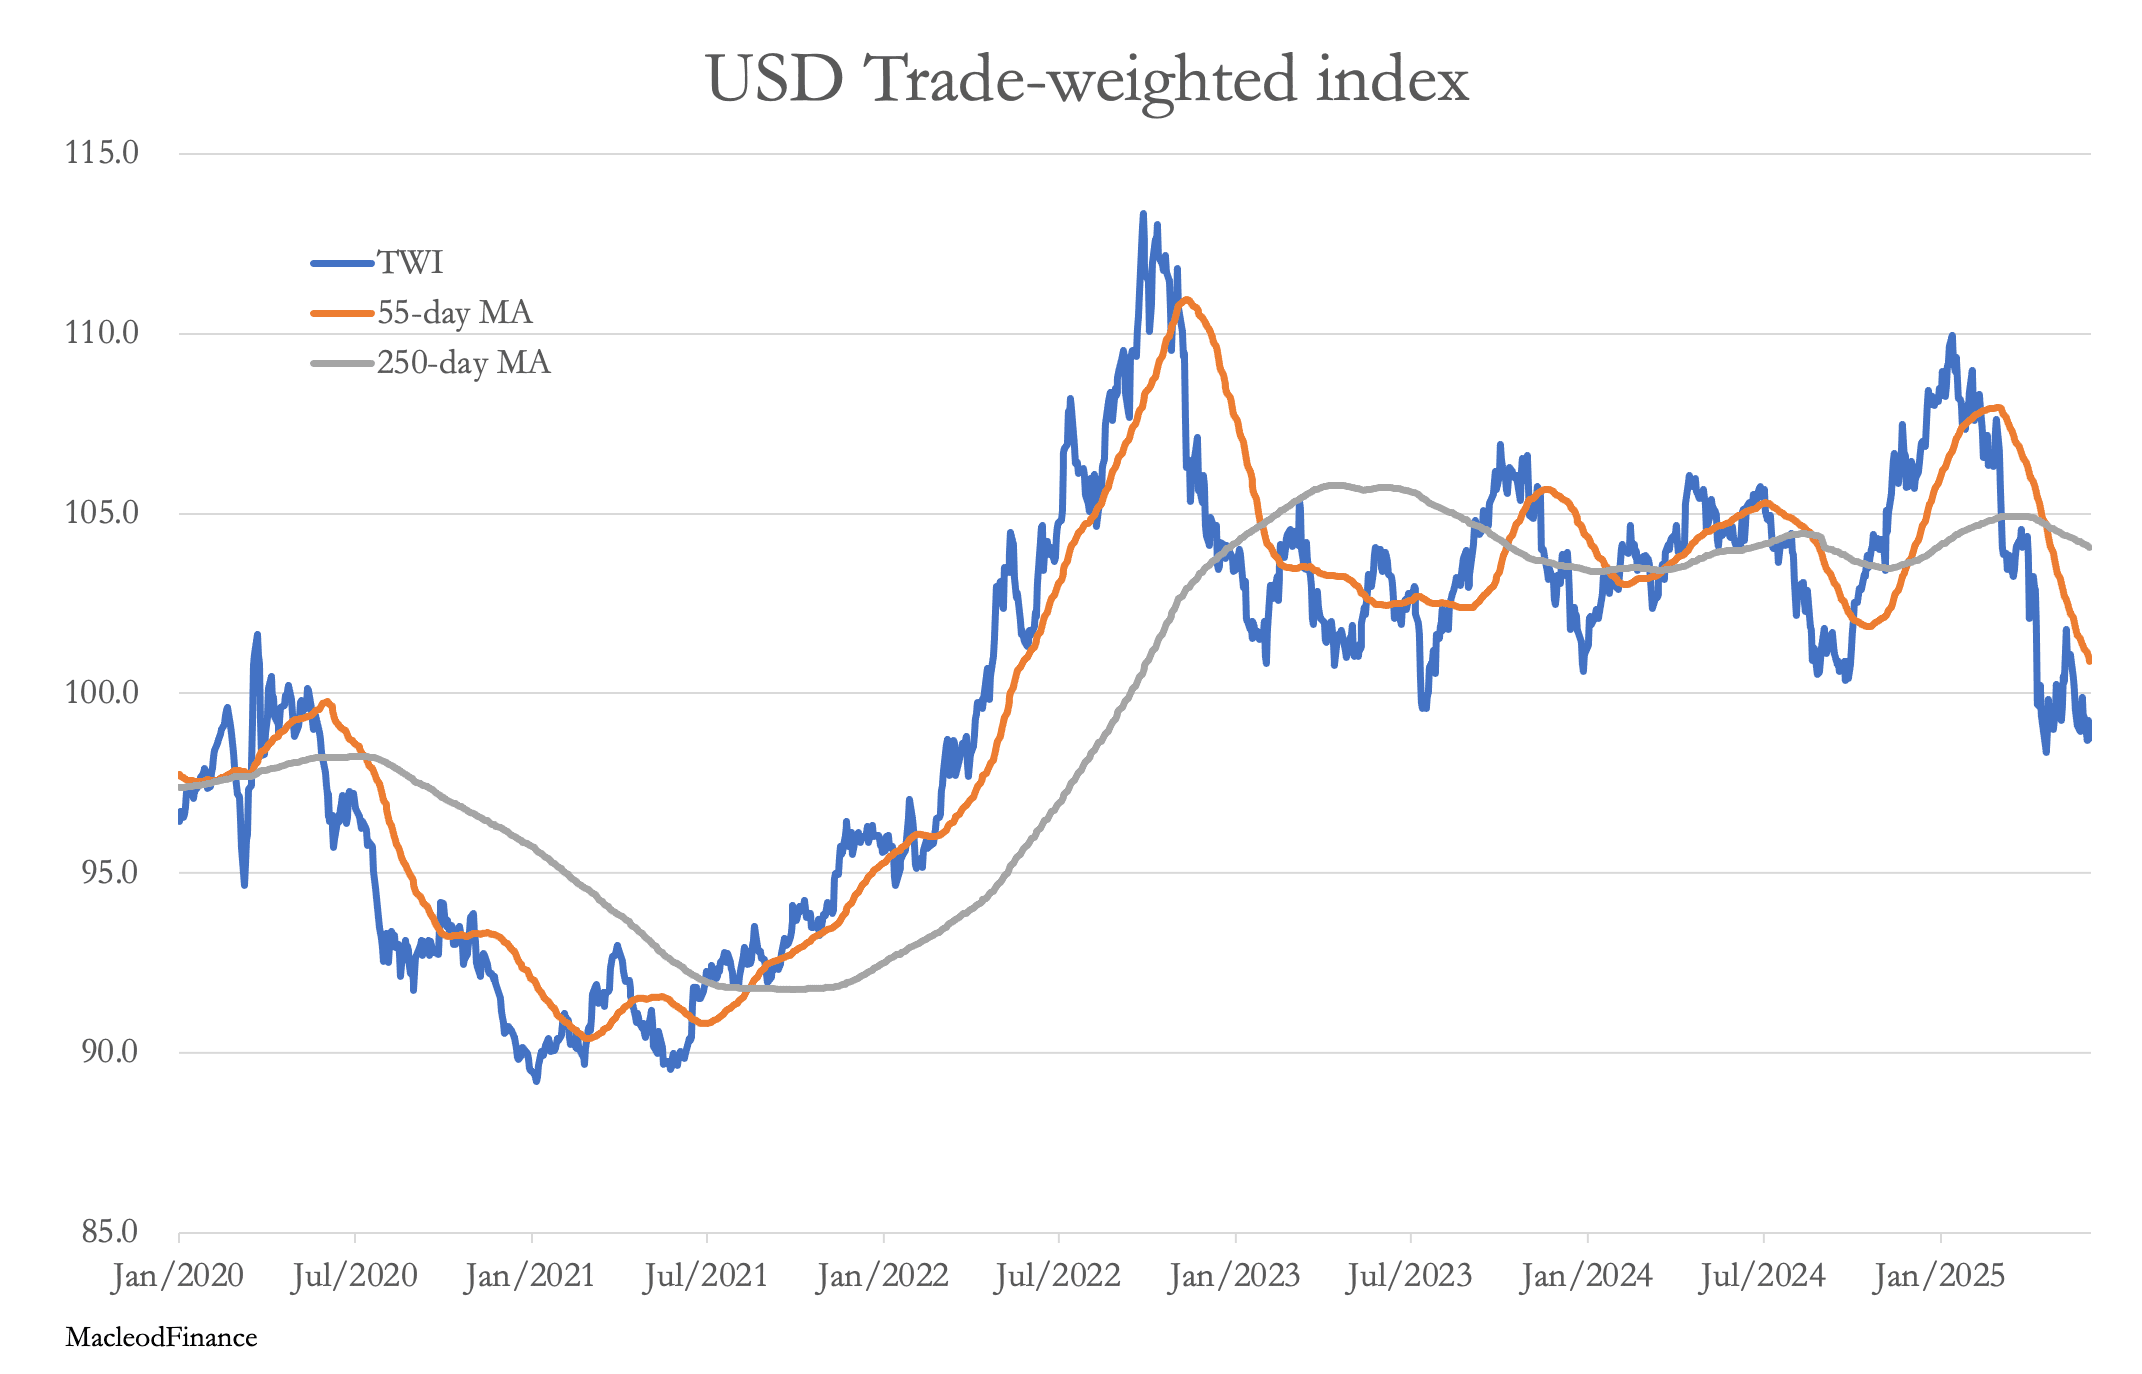
This is the underlying reason why gold and silver are rising. It is the dollar declining.