Market Report: Sharp recovery
Jun 10, 2016·Alasdair Macleod
Gold and silver enjoyed a strong recovery in the wake of an atrocious jobs report last Friday.
Gold and silver prices were given further upside momentum when Janet Yellen, speaking at the World Affairs Council in Philadelphia on Monday, consequently took a softer line on interest rate rises. Gold, which had bottomed at $1200 on Wednesday last week, took off like a scalded rabbit on last Friday’s jobs release, gaining $22 in seven minutes. If nothing else, the sharpness of the move reflected the high level of short-term bearishness. Anyway, it appears that the consolidation phase of this year’s gains may well be over – until, that is, we get the next interest rate scare.
Silver’s gain was more dramatic, as can be seen in the chart above. Only Wednesday last week, silver sold off to as low as $15.84. This week, it had recovered to $17.33 at its best yesterday, a gain of over 9%. Volatility of this sort can be taken as evidence of tight underlying physical supplies.
The make-up of physical demand this year has been very different from 2015, with Chinese deliveries to the general public from the Shanghai Gold Exchange dropping off from the record levels of last year. This is illustrated in the following chart, of monthly gold deliveries in tonnes.

Total deliveries in the first five months of 2016 totalled 834.6 tonnes, compared with 982.73 tonnes for the same period last year. It still represents the bulk of global mine output, but given this decline it is remarkable that the gold price has performed so well. The answer is that western demand, evidenced in increased ETF investment, is more than making up the difference, with GLD, the largest physical ETF, adding 240 tonnes alone. That Chinese demand seems to be cooling probably reflects a decline from the record levels of last year, and also, perhaps, because a series of small devaluations for the yuan has made gold more expensive when priced in yuan.
This change in market dynamics was very much in evidence this week, because the daily trading pattern has been for gold to rise in European and US trading hours, and to consolidate the previous day’s rises during Asian trading. However, the sheer speed of this week’s price rise can be expected to generate some mild profit-taking in European and US trading later today.
Measured in the major currencies, gold’s performance in sterling is now up 22% on the year, aided perhaps by the swing towards a Brexit vote. Gold in euros is up 15%, and in yen 7%. The prices, being lower in these two currencies than in the dollar (up 20%), should generate physical demand from these two currencies, both of which have negative interest rates.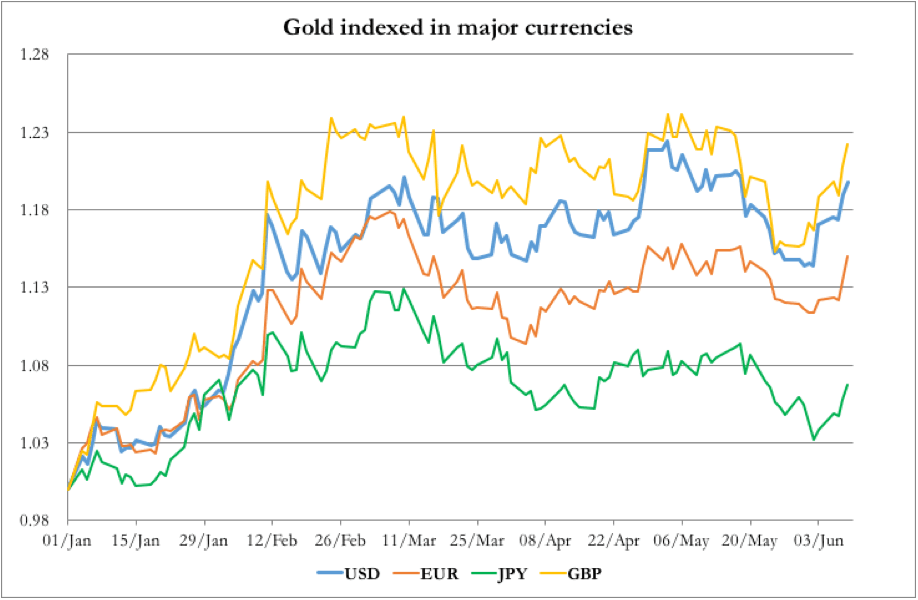
Put another way, gold priced in yen is theoretically too low, because the yen is too strong for its monetary stimulation, compared with gold priced in dollars, where the monetary conditions are more restrictive. It is an anomaly that applies to a lesser extent in euros. So long as these anomalies persist, it is likely to lead to growing demand for physical gold in both Japan and the Eurozone, though any change in Japanese demand so far has been too small to make a material difference.
The views and opinions expressed in the article are those of the author and do not necessarily reflect those of Goldmoney, unless expressly stated. Please note that neither Goldmoney nor any of its representatives provide financial, legal, tax, investment or other advice. Such advice should be sought from an independent regulated person or body who is suitably qualified to do so. Any information provided in this article is provided solely as general market commentary and does not constitute advice. Goldmoney will not accept liability for any loss or damage, which may arise directly or indirectly from your use of or reliance on such information.