What is holding gold back?
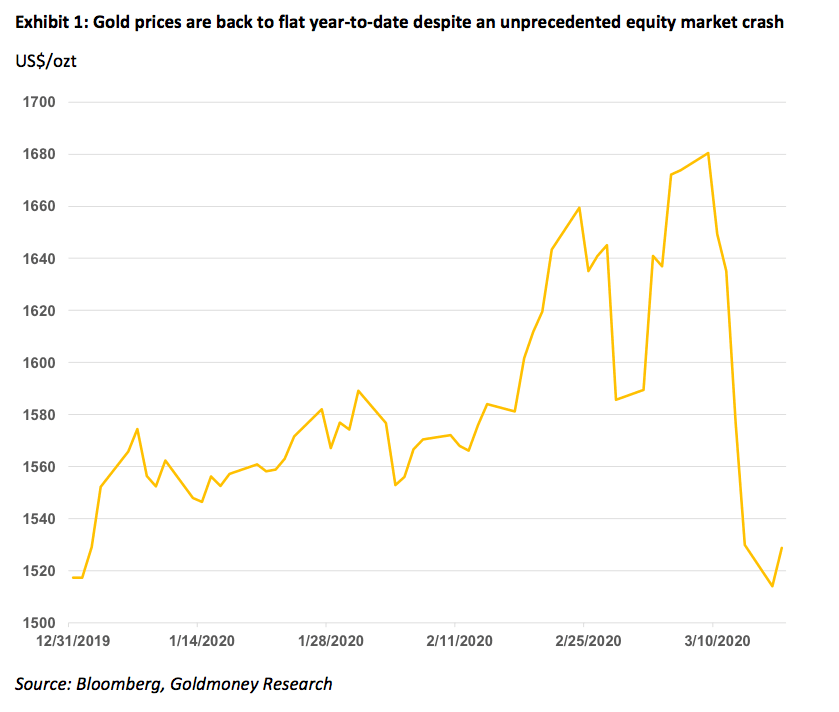
Mar 20, 2020·Goldmoney InsightsGold prices moved to $1700/ozt a few weeks ago as the market started to price in rate cuts. However, since then, prices have fallen back to below $1500/ozt despite broad market turmoil. We believe this price fall is mainly the result of sharply higher real-interest rate expectations as we are seeing a temporary surge in dollar demand. We think this could change on a dime. Massive renewed central bank intervention will push gold prices sharply higher to over $2600 over the medium term.
Many investors are scratching their heads. The Coronavirus outbreak is shocking global markets. Equities are crashing and rallying 10% from one-day to the next. The Fed has slashed rates to zero. There is a substantial risk that the economic impact from the virus – through supply chain disruptions and demand weakness – is pushing the world into a deep recession. And yet, despite all that, gold prices have been declining.
One would think that gold prices should go up simply because investors fleeing into safe havens. That alone should push gold prices higher. But more importantly, investors and savers have a clear idea what central banks are about to do over the coming months, and that should be very bullish gold. Over the past few days, the Fed has already unleashed a flurry of measures similar in size of what we saw at the peak of the credit crisis, but those measures have just fizzled. If we learned one thing from the credit crisis 2008-09, it is that central banks will do whatever it takes to save credit markets and “systemically important financial institutions” as well as trying to “stimulate demand” by flooding the market with cheap money. It is very unlikely that central banks will have a sudden change of heart in this aspect. Hence, because the recently introduced measures don’t work, they will simply do a lot more of it.

And equity markets are not even the Fed’s real problem. The dollar has shown extreme strength over the past few weeks. The Bloomberg dollar index tracks the performance of a basket of 10 leading global currencies versus the U.S. Dollar. According to Bloomberg, it has a dynamically updated composition and represents a diverse set of currencies that are important from trade and liquidity perspectives. The index has been on a steep upward trend since mid-February. There appears to be enormous dollar demand at the moment, and despite all the Fed intervention, it hasn’t stopped yet.
Therefore, we have little doubt that the Fed will introduce much more aggressive measures going forward, most likely coupled with aggressive and unprecedented fiscal stimulus. Last time, this happened, the result was that gold prices more than doubled over the subsequent 2 years. So why are gold prices not rising sharply? Why are they actually going down?
Using our gold price framework to analyze gold’s weak performance
In our gold price framework report (see Gold Price Framework Vol. 2: The energy side of the equation, 28 May 2018) we presented our gold pricing model in which we identified three main drivers for gold prices: Central bank policy (real-interest rate expectations and quantitative easing), net central bank gold sales and longer dated energy prices. In this report we will use this model to analyze the current state of the gold market and see whether the drivers we have identified, can explain the recent prices moves.

We find that the model predicts the recent downward price moves extremely well. So, what drives this sharp price decline in our model prediction? The two most important drivers in our model are longer dated energy prices and real-interest rate expectations. Both go sharply against gold at the moment: Longer dated energy prices are collapsing while real-interest rate expectations are rising sharply. In fact, our model would have predicted an even sharper decline, to around $1400/ozt, but likely investors do understand that this surge in real-interest rate expectations is a weird short term market reaction that is at odds with the longer term outlook for the dollar, given the Fed’s “whatever it takes” approach to get this under control. Hence gold prices aren’t fully reflecting the current higher real-interest rate expectations (rightfully so).
First driver: Longer dated energy prices
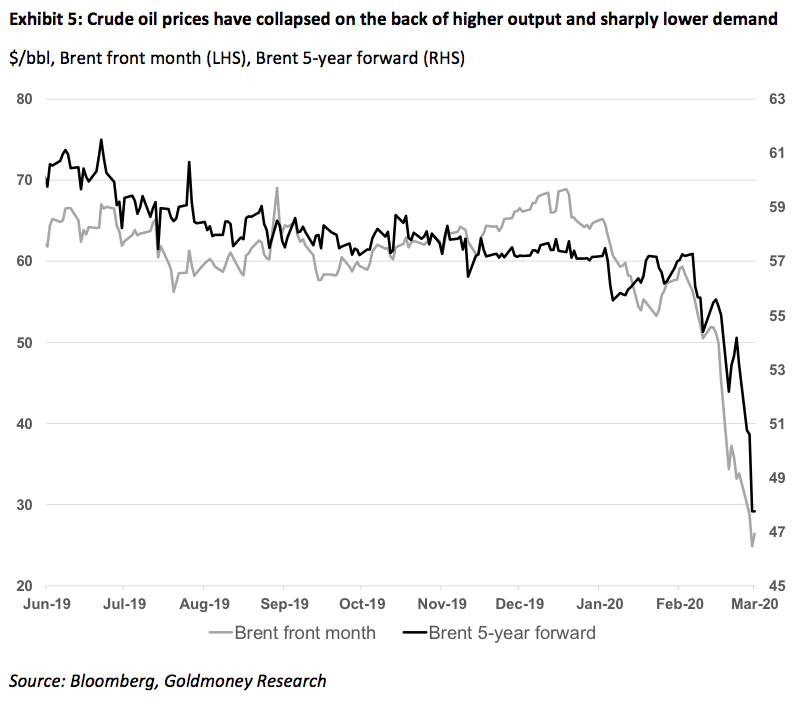
The sharp move lower in energy prices and the link to gold is intuitively understandable. Energy markets are currently very oversupplied. Demand for oil, gas, coal and power has dropped sharply as a result of widespread lockdowns in Asia, Europe and most slowly in the North America. Oil is particularly affected as the Coronavirus outbreak hits transportation fuel demand more than anything. On top of that, Saudi Arabia has declared an oil war when Russia refused to agree to an output cut, increasing output by over 2mb/d. The longer-term goal of OPEC (and Russia) is likely to force US shale producers out of business.
This potent combination of declining demand and increasing supply has led to a sharp decline in oil prices over the past weeks. While prompt prices are mostly affected, the back end was not immune against these price moves. 5-year forward Brent prices lost roughly 17% over the past 4 weeks alone.
As we have shown in our gold price framework, energy costs (both direct and indirect) account for about 70% of gold production costs. As we noted in the report:
“Importantly, while changes in energy spot prices change current production costs, what really matters for the price of gold are the longer-dated energy prices. Why is that? Imagine oil prices drop to USD10/bbl tomorrow because inventories reach storage capacity. Yet longer-dated oil prices remain at USD60/bbl because that is what is what the markets believes is required to ensure there is enough investment in future production capacity. So, which price should be reflected in the current gold price? We believe that the forward gold price should correspond the forward oil price as that is what will determine long term production costs for gold. However, unlike oil, gold can be stored at almost no cost and there are no storage capacity constraints. Hence the gold forward curve slope is essentially a function of lease rates. If spot prices divert from that relationship it would open an arbitrage opportunity that would quickly be exploited and, thus, vanish. As a result, when the oil forward curve is in steep contango, the gold spot price cannot trade at corresponding discount to the gold futures prices. Hence both gold forward and gold spot prices should reflect forward oil prices, not spot prices.”
Hence, gold prices do not reflect the full extent of the oil (and broader energy) price collapse in spot prices, but they reflect that longer-dated prices went significantly down as well. And it is not just longer-dated oil prices that went down. Longer-dated gas and coal prices are down as well, but there is much less liquidity in the back end of those curves, so it is harder to observe.
Second driver: Real interest rate expectations
While the effect of demand destruction on energy costs – and in turn production costs for gold - is somewhat straight forward and intuitive, current moves in real-interest rates expectations need a little more explanation.
Before we dive into the recent moves in real-interest rate expectations, we take a closer look at how real-interest rate expectations matter for gold. In our first volume of the gold price framework (see Gold Price Framework Vol. 1: Price Model,8. October 2015), we presented two explanations why we can observe such a strong correlation between gold prices and real-interest rates:
1. “Holding gold in a portfolio and not lending it out comes at a cost. A small fraction of that overall cost is for storage and insurance, but the main apparent cost is opportunity costs for foregone interest. This opportunity cost is larger, the higher real interest rates are. Hence, investors are less willing to hold a lot of gold when real rates are high, but would be likely to increase their holdings closer to their natural allocation of 10% when real rates are low. Importantly, if on aggregate people want to increase their gold allocation, there is nobody there to buy from. On aggregate, it is not possible to increase the amount of gold (in grams) in all portfolios at the same time as gold must come from somewhere. The only way for the entire population to be able to increase their aggregate gold allocation is for gold prices to rise relative to all other assets in the portfolio. In other words, the quantity of grams does not change, but a rise in the price of grams increases the value of gold measured as a percentage of the portfolio’s total value. This is consistent with our view that gold is money and that the price of gold should, therefore, be driven by monetary supply and demand for gold.
2. The second suggested explanation looks at it from a currency perspective. Falling real interest rates should, in theory, lead to a weaker currency and thus reduce demand for that currency. For example, when real interest rates fall in the US, the USD should become weaker relative to other currencies and monies, including gold. With emphasis on “in theory” as in reality, exchange rates are driven by a whole host of factors including the perceived financial and political stability of that country, its trade balance and more. Again, this approach is consistent with the view that gold is money and, therefore, the price of gold should be driven by monetary supply and demand.”

So, why are real-interest rate expectations currently spiking? Starting in late February, 10-year Treasury yields began to move sharply lower, in anticipation of Fed rate cuts. The Fed delivered in an emergency meeting on March 3, cutting rates by 50bp. Rates continued to move lower until March 9, 2020. By that time, 10-year treasury yields had fallen to just 55bps. However, simultaneously, long-term inflation expectations also began to fall sharply. By March 9, 10-year breakeven inflation expectations were just 1%.
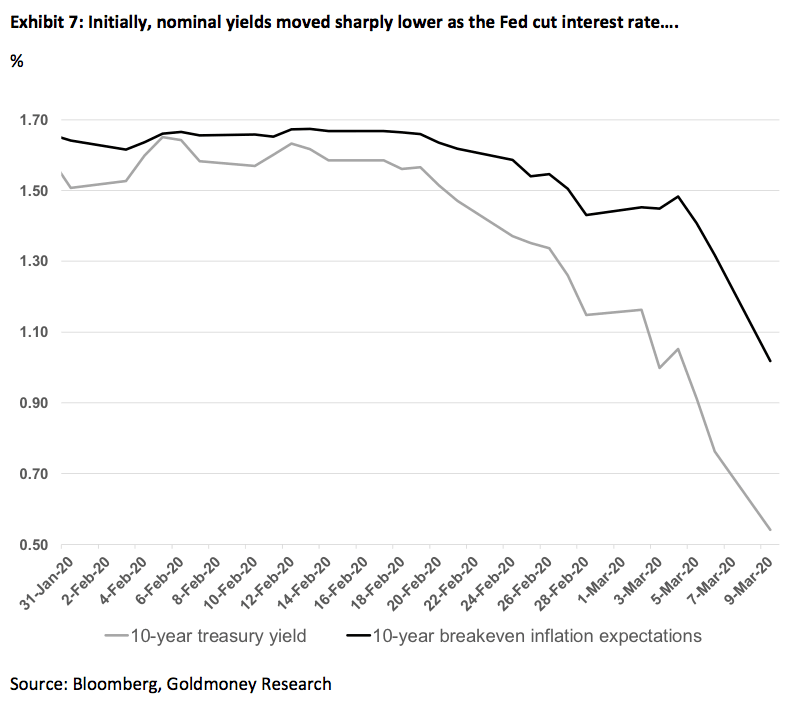
However, what happened next must have been a bit of a shock to the Fed. 10-year treasury yields began to rise. The Fed held a second emergency meeting on March 15, 2020, where it cut rates to zero. But this didn’t stop nominal yields, By March 19, 2020, 10-year treasuries rallied back to 1.15%. At the same time, long-term inflation expectations continued to collapse and are currently at just 0.5%.

So, what did all of this do to real-interest rate expectations? They spiked sharply, from -.057% to +0.55%.

This massive move in real-interest rate expectations is what we think was the main driver behind the recent gold price decline despite all the supposedly bearish macro events. What about the dollar strength you may ask? Arguably, a strong dollar tends to be bearish gold, so aren’t we simply seeing gold reacting to a stronger dollar? In our view, the dollar strength and the sharp upward move in USD real-interest rate expectations are two sides of the same coin and caused by the massive shockwaves penetrating the financial system which led to an unprecedented demand for USD.
To be clear, we do not think that this is caused by the market pricing in some long-term consequences of the current coronavirus-pandemic. These recent events have been long in the making, and the coronavirus-pandemic was simply what triggered it in the end. A decade of unprecedented central bank interventions on a global scale has been a fertile breeding ground for all kind of capital misallocations and left markets disconnected from underlying fundamentals. It all seems to be coming back to haunt us at the same time.
Where do we go from here?
We believe the strength in real-interest rate expectations is temporary. The Fed is desperately trying to get this dollar strength under control. They will do whatever it takes. In other words, they will supply credit markets with as much liquidity as they need. Unwinding their balance sheets – described by former Fed president Yellen “as boring as watching paint dry” – will never happen. Central banks will ramp up their asset purchase programs again and will extend it to assets they didn’t touch before, like equities in the US. But it seems that the same quantities of asset purchases that supposedly saved the market from abyss in 2009 no longer have any effects. This must have come as a huge shock to central bankers. It’s unlikely though, that because of that they will have a change of heart. The fact that markets are now almost pricing in deflation over the next 10 years thus gives central banks the pretense to do it all over again, just bigger.
As Milton Friedman famously once said: “Inflation is always and everywhere a monetary phenomenon in the sense that it is and can be produced only by a more rapid increase in the quantity of money than in output.”Central banks can always print more money. During and in the aftermath of the 2008-2009 credit crisis, central banks gave that money to the banks. But it seems to dawn to central bankers that this strategy no longer has the desired effects. While we expect renewed bailouts of both the financial and non-financial sector over the coming months, we believe there is an increased sense among central bankers that in order to fight the dreaded deflation, money should be directly given to the people. We are already seeing this practice in Asian economies to counter the negative economic effects of the Coronavirus. But more recently, this is seriously discussed even in the US.
Ultimately, this will lead to much lower real-interest rate expectations in one of two ways. Either inflation expectations go back up while nominal yields go down (this would mean central banks managed again to kick the can down the road), or nominal yields keep going up, but only because inflation starts going up much more (central banks lose control).
In the first case, the monetary world would enter a similar phase as in the aftermath of 2008-2009, where interest rates will be extremely low or negative while the balance sheets of central banks would hold even more assets than over the past 10 years. In this case we would expect gold prices to make new highs but stabilize eventually. Until it starts all over again.
In the latter case, central banks lose control over inflation. Debt levels are too high to reign it in like in the late 1970s early 1980s under chairman Volker as it would cripple the government, indebted households and corporations. In this case, we expect gold prices to go up significantly over many years as the purchasing power of the dollar would be declining.
History does not repeat, but it rhymes
Interestingly, on the brink of the credit crisis, a very similar thing happened. Equities had already peaked in 2007 and were slowly declining for about a year while gold moved gradually higher (like a slow-motion version of the past 3 months). However, from July 2008 to November 2008, gold prices moved sharply lower from close to $1000 to almost $700 amidst a massive equity sell-off and broad decline in asset values (real estate for example). Back then, the near 30% price decline was also driven by higher real-interest rate expectations (TIPS yields jumped from 1.5% to 3%) and sharply lower longer-dated energy prices (Brent 5-year forward from $140/bbl to $80/bbl). Subsequently, real-interest rate expectations dropped from over 3% to -1% on the back of unprecedented central bank intervention and longer-dated energy prices moved over $100/bbl again and gold rallied 250% over a period of 2.5 years.
In the current situation, the main move has come from the sharp spike in real-interest rate expectations. The decline in longer-dated energy prices contributed only marginally to the decline in gold prices. We also do not expect longer dated energy prices to move significantly lower from here. They are already too low and everything that happens today is strongly supportive for prices in a few years from now. Oil prices may face unprecedented demand destruction now, but we could also see unprecedented supply destruction in the near term if shale producers and even other producers start going bankrupt. CAPEX is already sharply reduced, even by OPEC producers such as Saudi Arabia. This will most likely accelerate the increase in longer dated prices we have been expecting for a while as conventional production is about to enter a long-term decline phase.
As for real interest rate expectations, they should have never acted in this way. We also do not expect this to last a lot longer. In 2008, it took central banks quite some time to understand the severity of the issue. They still remember that. Central banks are acting much more swiftly this time and are determined to nip a renewed credit crisis in the bud. Hence, this dollar strength and the associated rise in real-interest rate expectations could turn on a dime. TIPS yields are already reversing at the time of writing.
As we have highlighted before, historically the Fed has cut rates by 5.5% on average in a recession. As we hit the lower bound, we don’t think the Fed will push Fed Funds rates much lower, but it will do the equivalent in QE or something similar. The table below shows where our model predicts gold prices will go over the coming years.

Nominal rates peaked at 1.75% in this cycle. If the Fed cuts rate by the usual 5.5%, this would bring us to -3.75%. While we don’t expect the Fed to actually lower rates in such deep negative territory, we think they will do at least that in QE equivalent. Our model would predict gold prices to move to $2600/ozt or higher in such an environment.
These forecasts reflect the scenario where central banks are once again able to kick the can down the road. However, in our alternative scenario we described above, central banks lose control over inflation. In this scenario, gold prices will go much higher in our view.
The views and opinions expressed in this article are those of the author(s) and do not reflect those of Goldmoney, unless expressly stated. The article is for general information purposes only and does not constitute either Goldmoney or the author(s) providing you with legal, financial, tax, investment, or accounting advice. You should not act or rely on any information contained in the article without first seeking independent professional advice. Care has been taken to ensure that the information in the article is reliable; however, Goldmoney does not represent that it is accurate, complete, up-to-date and/or to be taken as an indication of future results and it should not be relied upon as such. Goldmoney will not be held responsible for any claim, loss, damage, or inconvenience caused as a result of any information or opinion contained in this article and any action taken as a result of the opinions and information contained in this article is at your own risk.