This is not 2008 – at least not for gold
Jan 26, 2016·Stefan WielerThis is not 2008 – at least not for gold
What a difference a month makes. As the market reassess growth and asset prices under renewed volatility – and with a more passive response from Central Banks thus far – the USD-gold price has remained remarkably stable and range-bound for over 10 weeks. Compared to most currencies and assets however, gold has had a remarkable past month: XAU/WTI +31%, XAU/S&P500 +14%, XAU/CAD +8%, XAU/RNB +6%; by the time of writing, the list goes on.
With markets in a sharp correction to start 2016, market commentators nevertheless still hold a downside bias for gold. The rationale for this downside has shifted however, from a fear of FED normalization to a fear that deflation and associated asset-capitulation would take gold lower in a "dollar short squeeze", reminiscent of gold's sell off in 2008. With a well-grounded framework for analyzing the gold price, we fear neither rationale; we still view a significant fall from today's level an unlikely outcome, or temporary at best. In fact, as many other asset classes are mired in wide valuation outlooks at either extreme (a binary outcome: normalization or capitulation), the three core drivers of the gold price remain firmly in gold's favor.
Ultimately, we believe that fear and speculative-sentiment flows have little if any lasting impact on gold - a $7 trillion money stock - and fundamentals are in fact supportive when compared to 2008. Given the asymmetry from these levels in the three main drivers of the gold price - energy, real interest rates, and Central Bank policy - we continue to see gold-price risk being skewed to the upside. We also conclude that gold is highly unlikely to move lower in the anecdotal "dollar short squeeze" absent real interest rate changes or dislocations in energy fundamentals, both coming off very different levels than 2008.
View the entire Research Piece as a PDF here...
This is not 2008 – at least not for gold
The investing crowd seems to be split in half. There are those who believe that this is just another brief correction in the broader markets, as we saw last August, and that this is now the time to buy as markets will recover quickly. The other side fears that things are unfolding as in 2008 all over again given the significant losses that could accrue from oil- or China/RMB devaluation-related credit shocks. Many believe that the unprecedented interventions from central banks around the world have inflated all asset classes and that these bubbles are now deflating, with the FED content to sit this one out and let animal spirits play their course given US labor market strength. The result, they fear, is that equity markets will come crashing down once again.
What these scenarios have in common however, is that they both apparently pose downside risk for gold prices in the anecdotes of most analysts. In the first scenario, further FED rate hikes seemingly create headwinds for gold. In the second scenario, gold would decline amidst a broader asset sell off, just as it did in 2008. We disagree in both cases. Rather, the three core drivers of the gold price are today firmly in gold's favor, regardless the path of equities or other asset classes. In this note we will use the 2008 gold-sell off to illustrate what the key drivers are that took gold prices down back then and explain why the same drivers are unlikely to push gold much lower from here in either scenario above.
Ultimately, real interest rates matter for gold, not nominal rates, and energy markets have virtually priced out future supply growth following an unprecedented supply glut. These factors help provide a solid floor for gold price fundamentals (in both supply and demand) under either market scenario.
The 2008 scenario
While gold has held up well over the past months, some people express concerns that gold might not be immune if markets deteriorate further. They are quick to point out that in early 2008, gold dropped from a high of $1003/ozt on March 14, 2008 to a low of $712/ozt on November 12, 2008 while the S&P500 lost over 30%.
The common narrative in the gold market is that gold prices are driven mainly by fear or greed. So why then back in 2008, amidst the greatest market panic in nearly a century, did gold not go higher, and actually declined in USD terms? The explanation we often hear is that the credit crisis lead to a flight to "quality", and the quality in 2008 was apparently the USD and government bonds. US investors liquidated foreign assets en masse and repatriated the money back to the USD, thus creating demand for USD. The story goes that not just did that not lead to more gold demand, gold was outright sold to meet margin calls. While we are not denying that these flows can have a short term impact on gold futures and push the price of gold above or below the fundamentally justified price over short periods of time, one does not need any of the above explanations to understand the drop in price in 2008. In fact, two variables – neither having anything to do, at least not directly, with either fear or greed - can explain almost the entire move.
Figure 1: At the beginning of the 2008 credit crisis, gold sold off as equities moved lower $/ozt (LHS); $ value index (RHS)

Source: Bloomberg, GoldMoney Research
We like to recall for our readers that we published our framework note on gold pricing last fall: Gold Price Framework Vol. 1: Price Model, where we presented our findings on how gold prices form. Solving for gold in US dollars, we found that the majority of price movements can be explained by just a few key drivers: real interest rate expectations, central bank policy, and changes in long-term energy prices. More specifically, the monthly change in the price of gold is primarily a function of monetary demand and supply for gold (COMEX net speculative positions, ETF and Central Bank net sales) and changes in the markets expectations for future energy prices, consistent with the view that gold is a store of value (money) with an energy intensive replacement cost. The first three factors impact gold prices because they directly affect the price of currency and demand for gold in portfolios, while energy feeds into production and replacement costs and derives its monetary proof of value.
Figure 2: Gold prices are mainly driven by real interest rates, central bank policy and longer-dated energy prices $/ozt

Source: Bloomberg, GoldMoney Research
Before 2008, gold had been on a steady rise, supported by the factors described above. Longer-dated energy prices had been rising for nearly a decade while real interest rates had declined for a decade. But these trends came to a sudden halt and a sharp reversal when the credit crisis started.
Longer-dated Energy prices moved lower....
The 5-year forward price for WTI went from $21/bbl in 2001 all the way to $85/bbl by the end of 2007. From there it moved higher in early 2008 but collapsed into year-end as the credit crisis hit full force, crippling global economic growth and thus the outlook for oil demand. Longer-dated oil prices as measured by the 5-year forward price fell 20% from $101/bbl (interim gold price peak in March) to $82/bbl (gold price trough in November). Our model predict that this has pushed gold prices lower by about $140/ozt (see Figure 3).
Figure 3: The decline in longer-dated energy prices and the sharp and sudden increase in real rates amidst the credit crisis created strong headwinds for gold $/bbl (RHS), % (LHS)
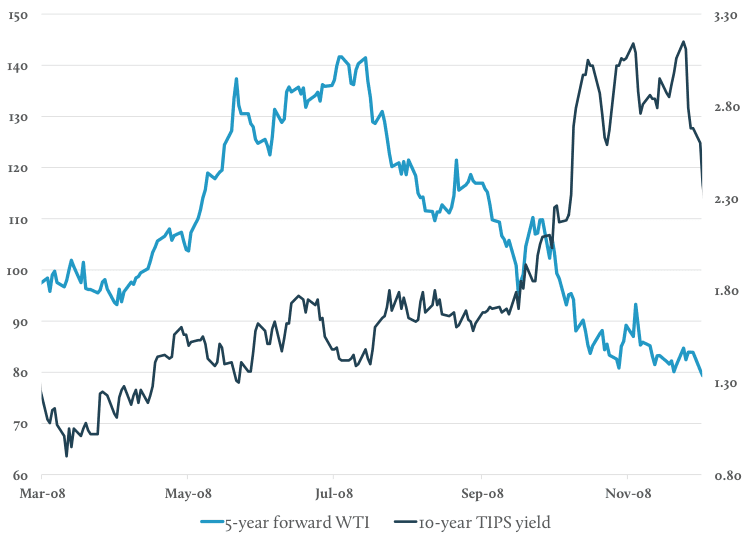
Source: FRED, Bloomberg, GoldMoney Research
...and real interest rates sharply higher
Real-interest rates, as measured by 10-year TIPS (Treasury Inflation Protected Securities), declined from an average 3.75% in the year 2000 to 1.8% by the end of 2007 and hit a low of 0.95% on March 12, 2008, exactly two days before the peak in the gold price. But as the credit crisis unfolded, inflation expectations waned and volatility increased. The result was that real-interest rates rose sharply to over 3% by October. On November 12, 2008, 10-year TIPS were 2.79%. Our model implies that this move had impacted gold prices by about $135/ozt.
The combined impact from a decline in longer-dated energy prices and the sharp move higher in real-interest rates explain about $275/ozt of the $282/ozt move lower in gold in 2008. From there the paths of the two drivers split. Longer-dated oil prices continued to move lower for a while, eventually hitting a low at around $66/bbl in spring 2009. This further decline in oil prices was offset by the sharp decline in real interest rates as the FED began to intervene in the markets, pushing real interest rates to new lows.
The takeaway is that the decline in the price of gold in 2008 can be explained quite well without the need of Malthusian thinking or the notion of "fear and speculation" which are typically cited when gold prices move against what common wisdom would predict. But more importantly, it helps us understand the current environment we are in and whether there is presently the risk that gold prices sell off in a broader market sell off.
In fact, the situation this time couldn't be more different in our view. First of all, energy prices have already sold off sharply. And by that we don't mean the decline in spot prices from $110/bbl to now under $30/bbl over the past 18 months. As we have shown in our framework note, it's not the oil spot price that drives gold, it's the market's expectation for future energy prices. Longer-dated oil prices peaked back in 2011 and have been on a downward trend since. 5-year forward WTI prices have dropped to $45/bbl, about 30% below the lowest levels during the credit crisis. These price levels now hold a significant asymmetry as well, as the entire oil curve prices below levels needed to arrest oil production declines and maintain the industry infrastructure required to meet future demand, as we will explain in more detail later in this report.
Figure 4: Long-dated energy prices are one of 3 important drivers for gold prices % change year-over-year

Source: Bloomberg, GoldMoney Research
Figure 5: While in 2008 long-dated energy prices were at a peak, they now at a low $/bbl

Source: Bloomberg, GoldMoney Research
Similarly, real-interest rates are not coming out of a multi-year decline as was the case in 2008. While they have declined for decades, for nearly 3 years they actually have been going up. Real-interest rates troughed in 2013 at -0.74% and have since recovered steadily back to 0.67% on the back of expectations for a series of FED hikes (see Exhibit 6&7).
Figure 6: The second important driver are real-interest rates, which are inversely correlated to gold
% change y-o-y (lhs), absolute change y-o-y (rhs)
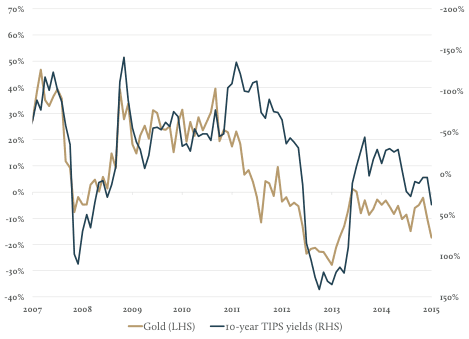
Source: FRED, Bloomberg, GoldMoney Research
Figure 7: Real-interest rates have been going up over the past years and are now at a high $/oz (lhs); % (rhs)

Source: Bloomberg, GoldMoney Research
The multi-year decline in the price of longer-dated oil combined with the recovery in real-interest rates was responsible for the gold price decline since its peak in 2011. While this created major headwinds for gold prices, it also implies that they are now behind us.
What are the risks to long-dated energy prices from here?
In our upcoming Framework Report Vol. 2 we will examine the energy side of the gold price equation in greater detail. But in a nutshell, long-dated oil prices have dropped to a level where a large share of future oil projects are no longer economical. US shale oil production, which was the main cause for the current oversupply, cannot grow over the next few years at the prices embedded in the forward curve and thus will continue to decline. The result is that future demand cannot be met with oil supply projections at the price levels currently embedded in the forward curve. Thus longer dated oil prices are unlikely to remain at these levels for an extended period. In a 2008 type scenario with broad based asset sell offs and a collapse in global economic growth would be bad news for oil spot prices. Relentless production growth have pushed global petroleum inventories already to all-time record highs on the back of falling oil prices, despite the fact that demand growth has been really strong. A slowdown in demand due to weaker global economic growth would lead to further builds, even production growth has slowed down dramatically by now. But as we explain in our framework report, inventories drive time-spreads and thus spot prices, not long-term prices. In a 2008 type scenario it would certainly be hard for long-dated oil prices to rally over the coming months, but again, given production economics for future supply, most of the decline in long-dated prices is likely behind us. Thus any further decline in long-dated prices would only have a very limited impact on gold. For example, were the 5-year forward price to drop by another 20% from here, it would take gold down a further $60-65/ozt. But at that point, a very large part of global oil production would be cash negative for the indefinite future and 100% of all future projects would be uneconomical.
What about real-interest rates?
Real-interest rates bucked their longer term downward trend over the past two years and recovered from negative -0.7% to +0.7%. The recovery was on the back of an apparently improving economy and the outlook for FED rate hikes after years of near zero interest rates. The FED finally came though and hiked rates by 25bp in December and held out further hikes in prospect through 2016. However, real-interest rates didn't rally after the hike, despite the fact that the market was divided whether the FED would actually be able to push further hikes through. In fact, expectations for FED interest rates levels by December 2016 have been on a downward trend for a while now. They spiked briefly approaching the Dec 15 FOMC meeting but since then have declined sharply again. The market is questioning whether the FED will be able to hike rates if markets continue to decline.
Figure 8: Expectations for FED funds rate by the end of 2016 as implied by the futures market have declined sharply %

Source: Bloomberg, GoldMoney Research
Importantly, should equity markets continue to sell-off, real-interest rates are unlikely to show a sharp move up comparable to 2008 again. With further sell-offs in equity markets, the market might start to price in lower growth, which in turn would put downward pressure on inflation expectations. However, in such a scenario, it's unlikely that the FED would continue hiking rates. A sharp deterioration in the economic outlook would most likely lead to a U-turn in the FEDs policy and the markets will anticipate that. We would expect that real-interest rates would be pushed lower again.
What if this was just a blip and equity markets recover, just as in August?
What about the scenario in which equity markets recover and the FED keeps hiking rates? As we have outlined above, what really matters for gold is real-interest rates, not nominal rates. To recall, real interest rates are measured as nominal interest rates minus inflation expectations. The easiest way to track real interest rates is via Treasury Interest Protected Securities (TIPS). There are two reasons why we think that even if the FED continues with further rate hikes, real-interest rates are unlike to go much higher.
First, Inflation expectations have been on a steady decline since the peak in gold in 2011, from around 3.6% to 2.6%. In our view the FED is unlikely to raise rates further in 2016 if this quells the last bit of inflation expectations.
Second, and more importantly, much of the expected further FED hike is already priced into TIPS yields. It was the outlook for rate hikes that brought TIPS yields from -0.7% to +0.7%. But over the past months, TIPS yields haven't moved much despite the fact that the FED actually did hike rates in December. Hence, further rate hikes as telegraphed by the FED probably won't have much impact on TIPS yields from here. Even if we assume there will be further rates hikes by 1% and if we assume they push 10-year Treasury yields up by a full percent with no change in inflation expectations, this would push 10-year TIPS yield only up 40bp. The impact on the gold price would be only about -$30/ozt, or about 3% from today's level. That is in a range of weekly volatility, hence it would be nearly just noise, rather than a meaningful fundamental decline in price. Arguably, the market seems to increasingly discount these rates hikes. At this point, the markets expectations embedded in the futures market for FED fund rates by the end of 2016 are at just 0.6%, much lower than the formal analyst consensus of 1.25% as reported by the Wall Street Journal and lower than the FEDs own guidance of a further 1% hike in 2016 bringing the FED fund rate to 1.25-1.5%. However, while the probabilities for 2016 rate hikes implied by the futures market have declined significantly, TIPS yields have not followed. TIPS yields continue to reflect higher FED funds expectations (or inflation expectations have declined, which would be a headwind for future FED hikes if correct). Hence, should the markets worries about a broader asset-sell off subside and probabilities for future FED rate hikes increase, it would most likely not impact TIPS yields much.
On the other hand, a rebound in confidence about the outlook from global growth would be positive for energy prices. Demand would remain strong on the back of low prices and accelerating economic growth, and, combined with continued slowdown in production growth, would lead to lower inventories. But more importantly, the market would have to reassess the outlook for future demand growth and the increasing risk that future supply will not be able to meet demand,. The result would be a recovery in long-dated energy prices, which would be positive for gold.
Hence, both low energy prices and higher real interest rates are already reflected in the current gold price. As longer-dated oil prices cannot remain below industry costs indefinitely, nor real interest rates rise much higher given a data dependent FED, this creates an asymmetry to gold prices, regardless of broader market normalization - or capitulation.
View the entire Research Piece as a PDF here...
The views and opinions expressed in this article are those of the author(s) and do not reflect those of GoldMoney, unless expressly stated. The article is for general information purposes only and does not constitute either GoldMoney or the author(s) providing you with legal, financial, tax, investment, or accounting advice. You should not act or rely on any information contained in the article without first seeking independent professional advice. Care has been taken to ensure that the information in the article is reliable; however, GoldMoney does not represent that it is accurate, complete, up-to-date and/or to be taken as an indication of future results and it should not be relied upon as such. GoldMoney will not be held responsible for any claim, loss, damage, or inconvenience caused as a result of any information or opinion contained in this article and any action taken as a result of the opinions and information contained in this article is at your own risk.