Market Report: Gold firmly underwritten at $1300
Feb 15, 2019·Alasdair MacleodGold and silver had another week of consolidation, with gold up $3.00 at $1317.50 from last Friday’s close in morning European trade. Silver however, lost 12 cents to stand at $15.70.

This week’s headline chart has been rebased to end-June to better illustrate gold’s established trend since mid-November, after gold had found a base following its dramatic sell-off in September. The trend is shown by the arrowed line, which has now made five touch points, more accurately shown at intraday lows than the closing values in the chart.
Silver’s disappointing performance is a reflection of the growing monetary uncertainly that benefits gold. Gold is the precious metal to watch, given the global economic slowdown and the easier monetary policies that are emerging.
So far, Comex volumes have been subdued, confirming an absence of the speculative buying that usually accompanies an overvalued market. This is good news for the gold price, reflected in the chart covering the last four years, shown below.

Everything appears to be in place for a tilt at the old highs above $1350. There is the bullish golden cross, the holding of support at $1300, subdued Comex volumes and the well-defined short-term uptrend shown in our headline chart.
The larger picture shows a bull market which commenced in December 2015, followed by a two-year consolidation. All that’s needed is a final confirmation of a break-out above $1350. There appears to be sufficient momentum for this to happen.
The dollar’s trade-weighted index is being buoyed up by the weakness of its major component, the euro.

The TWI has had a classic rally towards a test of the trendline broken on 1 January. It will now need to maintain the 95 level if further falls towards 88 are to be avoided. This is eminently possible, given the worse than expected slump that’s emerging in the Eurozone. In the last two months of 2018, Italy’s output fell by 5.5% and Spain’s by 6.7%. Ireland, recorded a slump of 19.8%, blamed by incredulous analysts on partly defective data. Germany’s industrial production fell by 1.7%. Eurozone motor manufacturers face the added prospect of 25% tariffs exports to the USA, a possibility heightened yesterday in a US Commerce Department report due to be released this weekend, which will state that car imports threaten national security.
Therefore, the euro is in deep trouble from both prospective trade tariffs and Brexit. The Eurozone is not alone, with the world’s production growth shuddering to a halt. It means lower interest rates and more monetary inflation, and perhaps it is this that might drive gold out of its consolidation phase in the next leg of a significant bull market.
Priced in sterling and euros in particular, gold is doing what it should by reflecting the relative weakness of these currencies. This is shown in the last chart.
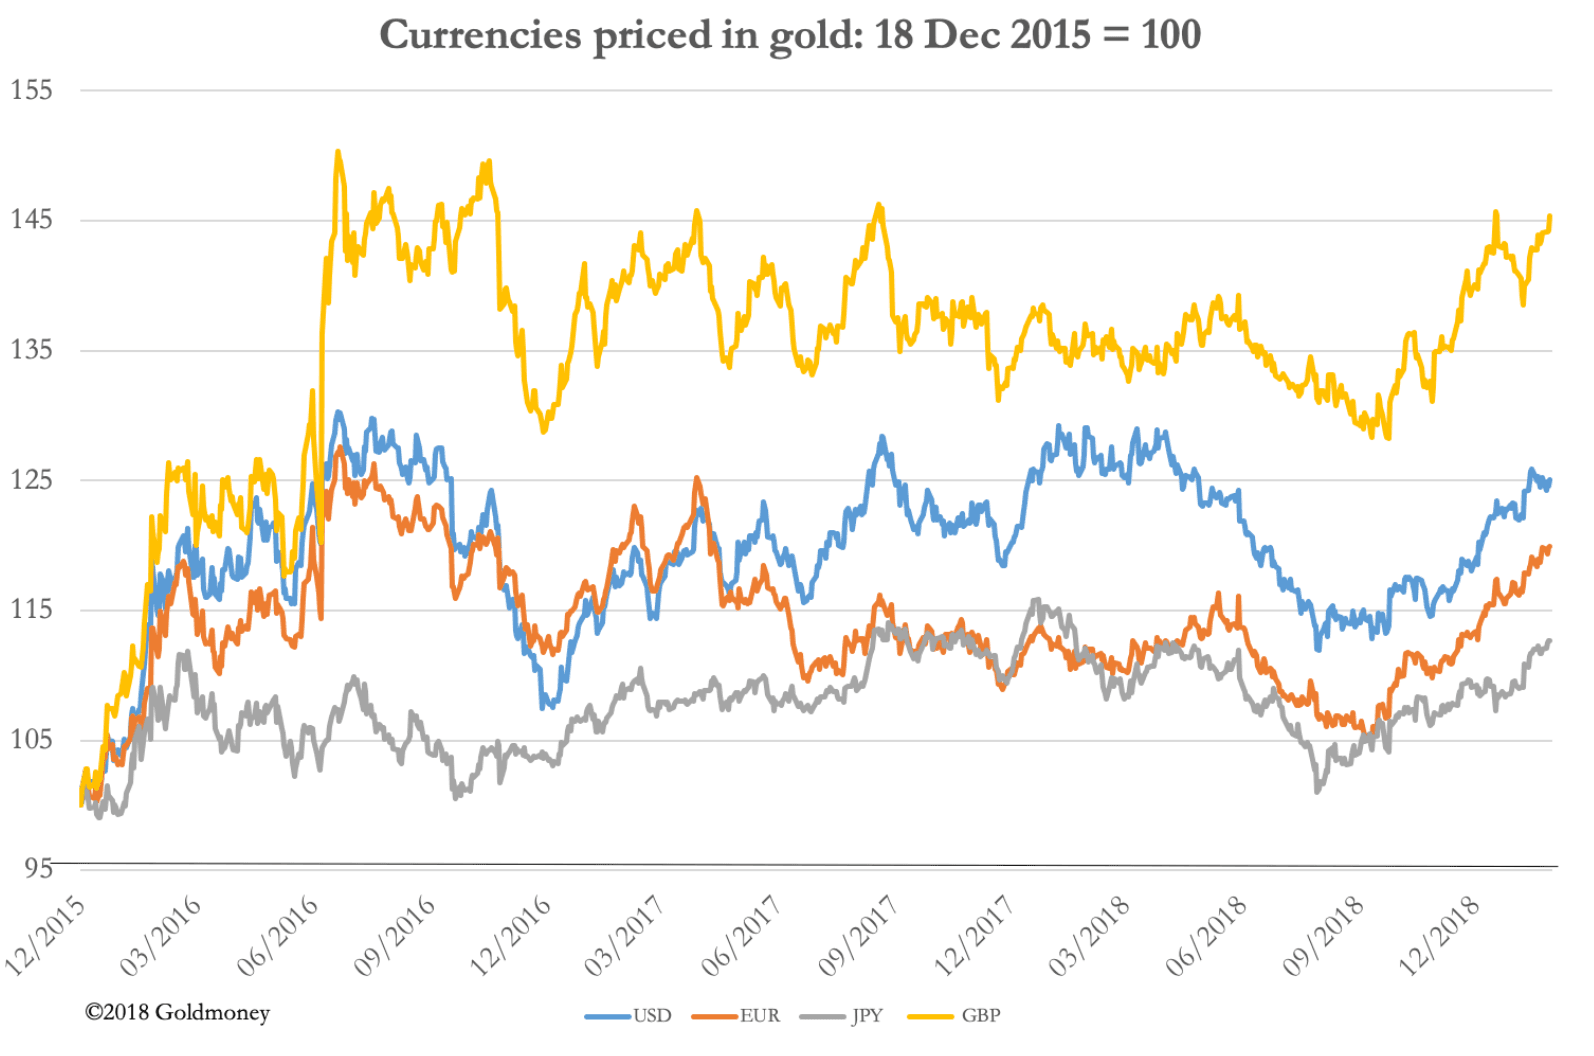
Since the December 2015 low, the sterling price of gold is up 45%, in euros up 20%, Yen up 12.7%, and in the dollar up 25%.
The views and opinions expressed in this article are those of the author(s) and do not reflect those of Goldmoney, unless expressly stated. The article is for general information purposes only and does not constitute either Goldmoney or the author(s) providing you with legal, financial, tax, investment, or accounting advice. You should not act or rely on any information contained in the article without first seeking independent professional advice. Care has been taken to ensure that the information in the article is reliable; however, Goldmoney does not represent that it is accurate, complete, up-to-date and/or to be taken as an indication of future results and it should not be relied upon as such. Goldmoney will not be held responsible for any claim, loss, damage, or inconvenience caused as a result of any information or opinion contained in this article and any action taken as a result of the opinions and information contained in this article is at your own risk.