Market Report: Paper gold and silver crash
Mar 13, 2020·Alasdair Macleod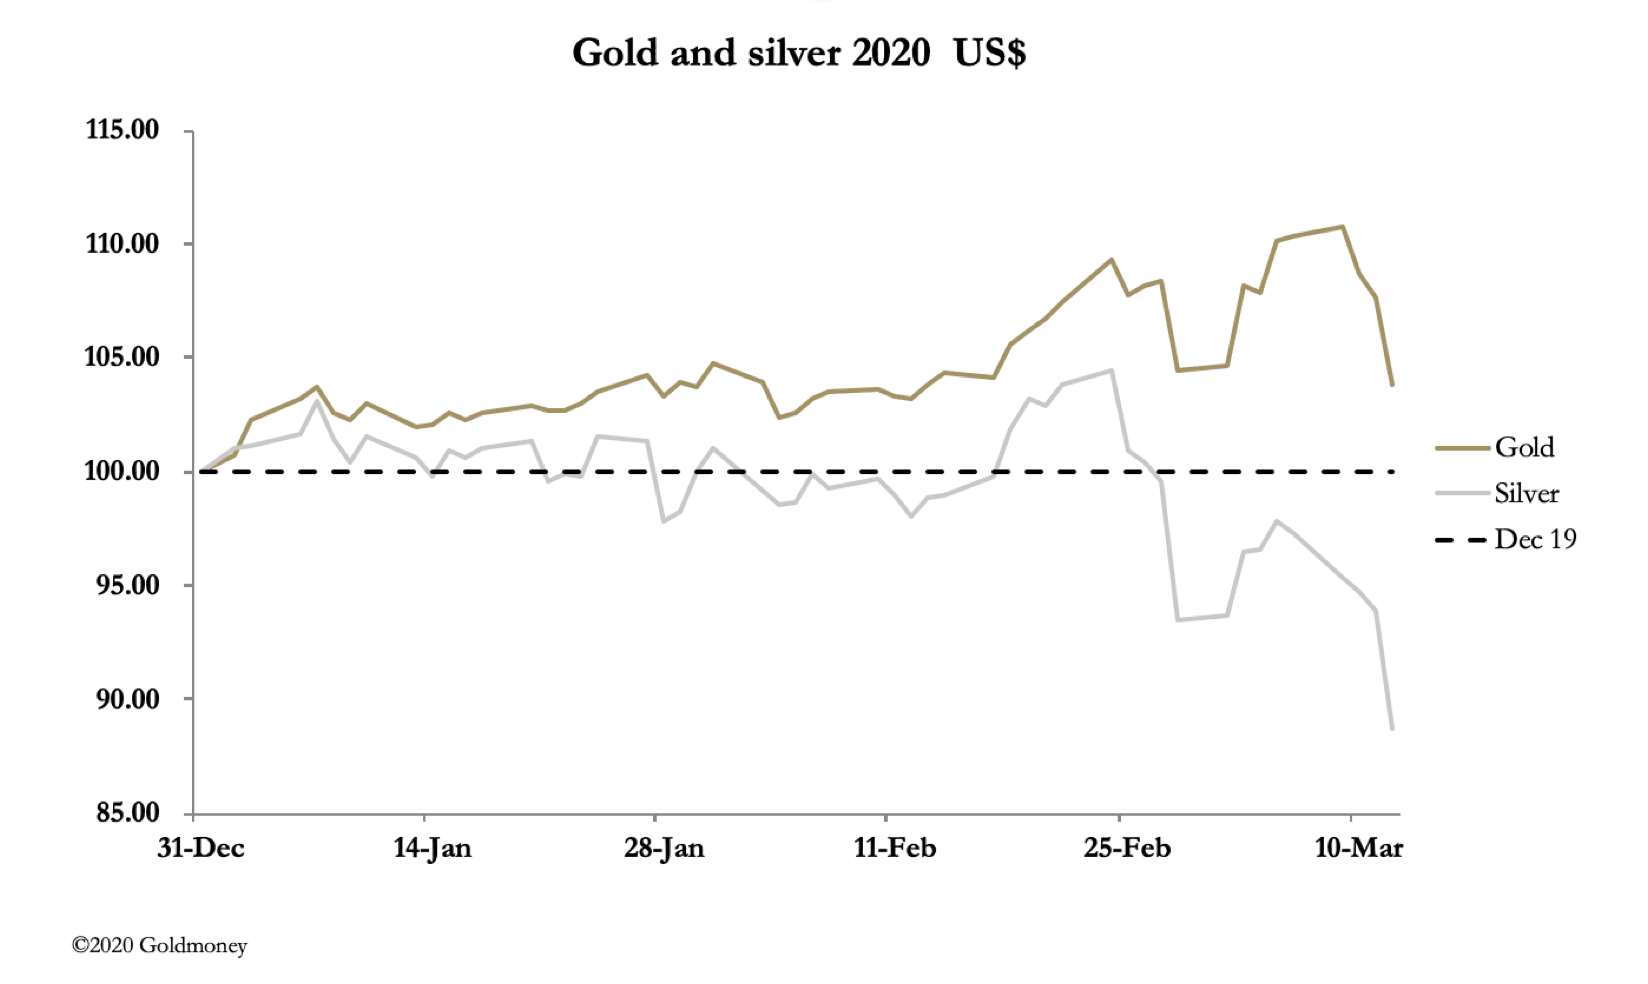
As our headline chart shows, gold and silver prices fell heavily over the week, with silver crashing relative to gold. The gold/silver ratio now stands at 101.5, pretty much a record.
Gold was down $97 on the week by early morning trade in Europe at $1584, and silver down $1.75 at $15.67. On the year so far, gold is still up by 3.9%, but silver is down 11.3%.
This week saw equity markets crashing. In only three weeks the S&P500 Index had fallen 35% by last night, 9.5% of it yesterday. Bond yields have collapsed in a run to safety, with the 10-year US Treasury bond yield falling to 0.5% on Monday, though it rallied to 0.85% last night. And the dollar’s trade-weighted index hit a low of 94.9, before recovering to 97.9 last night. This is our next chart.

The break downwards from a weak broadening top was sudden, as was the partial recovery. The best that can be said is the odds favour both a weaker dollar and a higher level of currency volatility.
Gold’s technical chart is next up.

Yesterday’s sell-off has taken gold back to test the 55-day moving average, a logical support area for short-term traders.
Volatility in financial markets is being driven by a combination of previously extreme market optimism, a stock market bubble, and the sudden interposition of reality in the form of the coronavirus and its economic disruption. A fall of 35% for the S&P500 in only three weeks echoes the beginnings of the Wall Street crash in September/October 1929. Various Goldmoney Insight articles have argued the similarities between then and now over the last eighteen months: the end of the credit cycle and escalating trade protectionism. If the analogy holds, there are further falls to come for equity markets, perhaps impelled more rapidly by the virus.
It is a problem for financial assets generally, which includes futures. Stories of traders having to close out gold and silver futures to cover losses in equity markets abound.
Central banks have reduced interest rates (Fed, BoE) and announced liquidity injections (Fed, ECB, BoJ). In the Fed’s case a further $1.5 trillion will be injected into credit markets, an unprecedented quantity. Governments are also spending like drunken sailors (UK) and helicoptering money (Hong Kong).
But in all this, we must not lose sight of this story playing into the hands of the shorts on Comex. Our next chart shows how extreme the short positions of second-line bullion banks had become.

The last available data point was 3 March, when the gold price was $1640 and open interest was 90,000 contracts higher than at last night’s close. Wrong-footed bullion banks will be very relieved and given the opportunity would like to get an even book. For it must be the case that in all the financial disruption, the rapid and generally unexpected expansion of money fully justifies far higher gold and silver prices, something obvious even to the management of bullion banks.
The views and opinions expressed in this article are those of the author(s) and do not reflect those of Goldmoney, unless expressly stated. The article is for general information purposes only and does not constitute either Goldmoney or the author(s) providing you with legal, financial, tax, investment, or accounting advice. You should not act or rely on any information contained in the article without first seeking independent professional advice. Care has been taken to ensure that the information in the article is reliable; however, Goldmoney does not represent that it is accurate, complete, up-to-date and/or to be taken as an indication of future results and it should not be relied upon as such. Goldmoney will not be held responsible for any claim, loss, damage, or inconvenience caused as a result of any information or opinion contained in this article and any action taken as a result of the opinions and information contained in this article is at your own risk.